Size of bars changing unexpectingly after applying a `filter data by values`

Hi everybody,

Context

I’m trying to create a new panel with a bar plot displaying how much volume is delivered by a pump (using Grafana v7.5.0, on Linux).
After an Outer join transformation on two queries from the same data source, I obtained the expected data as shown on a Table visualization.
When switching from Table to Graph visualization, we can see each volume delivered by its corresponding pump. So far, so good.

Problem

When applying a filter data by values (Include ; Match all ; Field pump Is equal 2), then the thin bar becomes a wide bar… the width of the bar still varies if two data is displayed (for example, with Is lower or equal 3 instead of Is equal 2). It is the same with the Time series visualization.

Is it the normal result? And, is there any way to keep thin bars that I am missing?

Thanks a lot!

hi @jegrafana

I’m trying to reproduce this, but having trouble. What exact version are you using?

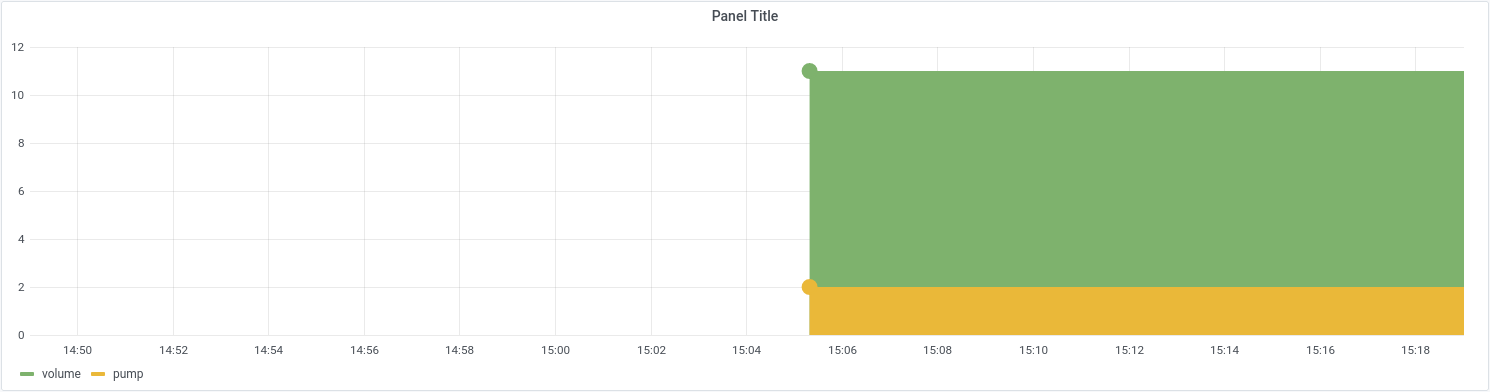
I used almost the exact same data, except for the timestamp spacing, and on 7.5.0, but I could neither reproduce the pencil-thin bars or the wide ones. Here is my dashboard json. Can you try importing this as a new dashboard and see what it looks like? You will need to add the test db datasource, which is built in to Grafana:

{
  "annotations": {
    "list": [
      {
        "builtIn": 1,
        "datasource": "-- Grafana --",
        "enable": true,
        "hide": true,
        "iconColor": "rgba(0, 211, 255, 1)",
        "name": "Annotations & Alerts",
        "type": "dashboard"
      }
    ]
  },
  "editable": true,
  "gnetId": null,
  "graphTooltip": 0,
  "id": 1,
  "links": [],
  "panels": [
    {
      "datasource": null,
      "fieldConfig": {
        "defaults": {
          "color": {
            "mode": "thresholds"
          },
          "custom": {
            "align": null,
            "filterable": false
          },
          "mappings": [],
          "thresholds": {
            "mode": "absolute",
            "steps": [
              {
                "color": "green",
                "value": null
              },
              {
                "color": "red",
                "value": 80
              }
            ]
          }
        },
        "overrides": []
      },
      "gridPos": {
        "h": 8,
        "w": 12,
        "x": 0,
        "y": 0
      },
      "id": 4,
      "options": {
        "frameIndex": 0,
        "showHeader": true
      },
      "pluginVersion": "7.5.0",
      "targets": [
        {
          "alias": "",
          "csvWave": {
            "timeStep": 60,
            "valuesCSV": "0,0,2,2,1,1"
          },
          "hide": false,
          "lines": 10,
          "points": [
            [
              16,
              1626210013000
            ],
            [
              11,
              1626210073000
            ],
            [
              23,
              1626210133000
            ],
            [
              32,
              1626210193000
            ]
          ],
          "pulseWave": {
            "offCount": 3,
            "offValue": 1,
            "onCount": 3,
            "onValue": 2,
            "timeStep": 60
          },
          "refId": "A",
          "scenarioId": "manual_entry",
          "stream": {
            "bands": 1,
            "noise": 2.2,
            "speed": 250,
            "spread": 3.5,
            "type": "signal"
          },
          "stringInput": ""
        },
        {
          "alias": "",
          "csvWave": {
            "timeStep": 60,
            "valuesCSV": "0,0,2,2,1,1"
          },
          "hide": false,
          "lines": 10,
          "points": [
            [
              3,
              1626210013000
            ],
            [
              2,
              1626210073000
            ],
            [
              4,
              1626210133000
            ],
            [
              6,
              1626210193000
            ]
          ],
          "pulseWave": {
            "offCount": 3,
            "offValue": 1,
            "onCount": 3,
            "onValue": 2,
            "timeStep": 60
          },
          "refId": "B",
          "scenarioId": "manual_entry",
          "stream": {
            "bands": 1,
            "noise": 2.2,
            "speed": 250,
            "spread": 3.5,
            "type": "signal"
          },
          "stringInput": ""
        }
      ],
      "title": "Panel Title",
      "transformations": [
        {
          "id": "seriesToColumns",
          "options": {
            "byField": "time"
          }
        },
        {
          "id": "organize",
          "options": {
            "excludeByName": {},
            "indexByName": {},
            "renameByName": {
              "value A-series": "volume",
              "value B-series": "pump"
            }
          }
        }
      ],
      "type": "table"
    },
    {
      "datasource": null,
      "fieldConfig": {
        "defaults": {
          "color": {
            "mode": "palette-classic"
          },
          "custom": {
            "axisLabel": "",
            "axisPlacement": "auto",
            "barAlignment": 1,
            "drawStyle": "bars",
            "fillOpacity": 88,
            "gradientMode": "none",
            "hideFrom": {
              "graph": false,
              "legend": false,
              "tooltip": false
            },
            "lineInterpolation": "linear",
            "lineWidth": 0,
            "pointSize": 6,
            "scaleDistribution": {
              "type": "linear"
            },
            "showPoints": "always",
            "spanNulls": false
          },
          "mappings": [],
          "thresholds": {
            "mode": "absolute",
            "steps": [
              {
                "color": "green",
                "value": null
              },
              {
                "color": "red",
                "value": 80
              }
            ]
          },
          "unit": "short"
        },
        "overrides": []
      },
      "gridPos": {
        "h": 8,
        "w": 12,
        "x": 12,
        "y": 0
      },
      "id": 5,
      "options": {
        "graph": {},
        "legend": {
          "calcs": [],
          "displayMode": "list",
          "placement": "bottom"
        },
        "tooltipOptions": {
          "mode": "single"
        }
      },
      "pluginVersion": "7.5.0",
      "targets": [
        {
          "alias": "",
          "csvWave": {
            "timeStep": 60,
            "valuesCSV": "0,0,2,2,1,1"
          },
          "hide": false,
          "lines": 10,
          "points": [
            [
              16,
              1626210013000
            ],
            [
              11,
              1626210073000
            ],
            [
              23,
              1626210133000
            ],
            [
              32,
              1626210193000
            ]
          ],
          "pulseWave": {
            "offCount": 3,
            "offValue": 1,
            "onCount": 3,
            "onValue": 2,
            "timeStep": 60
          },
          "refId": "A",
          "scenarioId": "manual_entry",
          "stream": {
            "bands": 1,
            "noise": 2.2,
            "speed": 250,
            "spread": 3.5,
            "type": "signal"
          },
          "stringInput": ""
        },
        {
          "alias": "",
          "csvWave": {
            "timeStep": 60,
            "valuesCSV": "0,0,2,2,1,1"
          },
          "hide": false,
          "lines": 10,
          "points": [
            [
              3,
              1626210013000
            ],
            [
              2,
              1626210073000
            ],
            [
              4,
              1626210133000
            ],
            [
              6,
              1626210193000
            ]
          ],
          "pulseWave": {
            "offCount": 3,
            "offValue": 1,
            "onCount": 3,
            "onValue": 2,
            "timeStep": 60
          },
          "refId": "B",
          "scenarioId": "manual_entry",
          "stream": {
            "bands": 1,
            "noise": 2.2,
            "speed": 250,
            "spread": 3.5,
            "type": "signal"
          },
          "stringInput": ""
        }
      ],
      "timeFrom": null,
      "timeShift": null,
      "title": "Panel Title",
      "transformations": [
        {
          "id": "seriesToColumns",
          "options": {
            "byField": "time"
          }
        },
        {
          "id": "organize",
          "options": {
            "excludeByName": {},
            "indexByName": {},
            "renameByName": {
              "value A-series": "volume",
              "value B-series": "pump"
            }
          }
        },
        {
          "id": "filterByValue",
          "options": {
            "filters": [
              {
                "config": {
                  "id": "lowerOrEqual",
                  "options": {
                    "value": 3
                  }
                },
                "fieldName": "pump"
              }
            ],
            "match": "all",
            "type": "include"
          }
        }
      ],
      "type": "timeseries"
    }
  ],
  "refresh": false,
  "schemaVersion": 27,
  "style": "dark",
  "tags": [],
  "templating": {
    "list": []
  },
  "time": {
    "from": "now-6h",
    "to": "now"
  },
  "timepicker": {},
  "timezone": "",
  "title": "table test",
  "uid": "YieSxai7z",
  "version": 7
}

also, if you visit this recreations of your table on play.grafana.org, you can see how the width of the bars relate to the time interval:

https://play.grafana.org/d/XDcIB-m7z/table-test-copy?orgId=1&from=1626210003385&to=1626210118464