How to increase number of concurrent queries, to render for example repated panels all at once, not 5 panels at the time, how it works now.
If I have set in grafana playground to repeat panels by some parameter, 5 queries are loaded and panels rendered, and ten another 5 panels etc.
It is visible in below network stats of chrome, where I set 3G throttling for network for better visibility of how queries are executed.
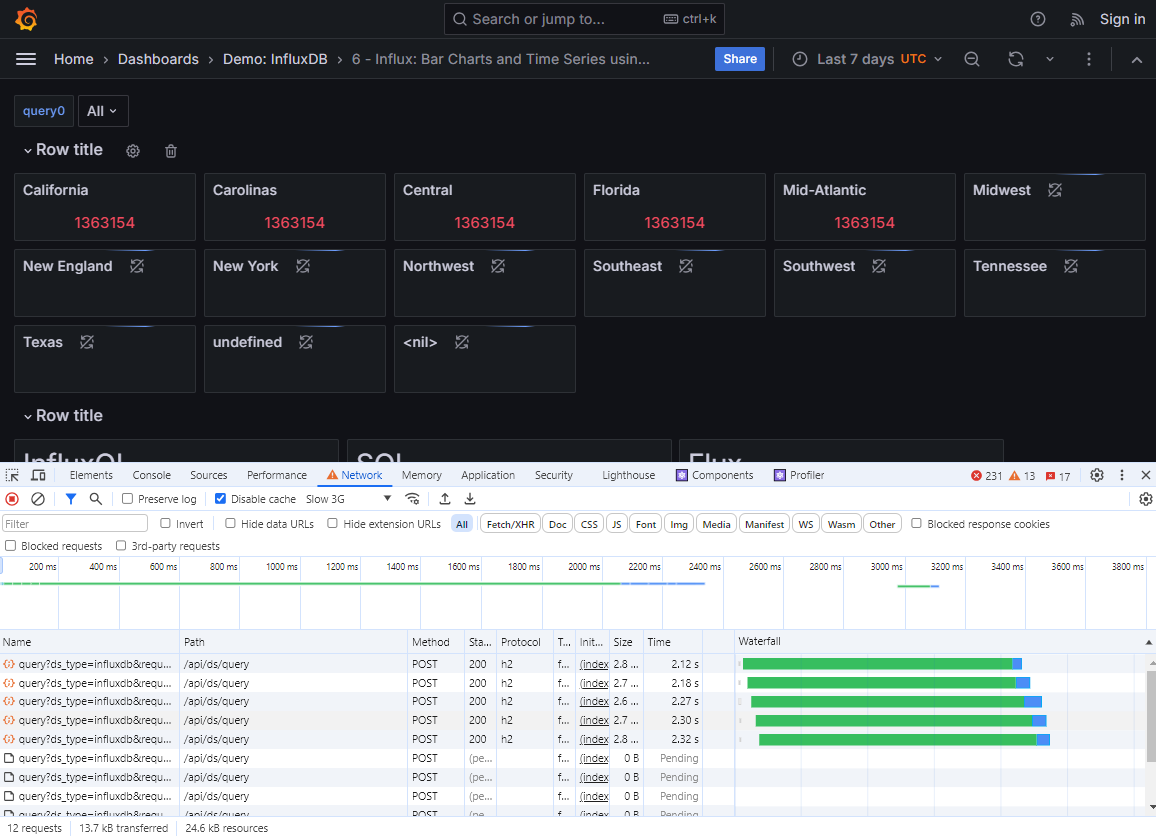

Same behavior seems to work in single panel, where are mixed multiple datasources. Also only 5 queries are executed at once.
I have set also “concurrent_query_limit” in .ini file but it did not helped.
Here is JSON of dashboard I used on https://play.grafana.org/
{
"annotations": {
"list": [
{
"builtIn": 1,
"datasource": {
"type": "grafana",
"uid": "-- Grafana --"
},
"enable": true,
"hide": true,
"iconColor": "rgba(0, 211, 255, 1)",
"name": "Annotations & Alerts",
"type": "dashboard"
}
]
},
"editable": true,
"fiscalYearStartMonth": 0,
"graphTooltip": 0,
"id": 2343,
"links": [],
"liveNow": false,
"panels": [
{
"collapsed": false,
"gridPos": {
"h": 1,
"w": 24,
"x": 0,
"y": 0
},
"id": 26,
"panels": [],
"title": "Row title",
"type": "row"
},
{
"datasource": {
"type": "influxdb",
"uid": "ddcc45ee-bd0a-4976-856d-ce7060c3fd56"
},
"fieldConfig": {
"defaults": {
"color": {
"mode": "thresholds"
},
"mappings": [],
"thresholds": {
"mode": "absolute",
"steps": [
{
"color": "green",
"value": null
},
{
"color": "red",
"value": 80
}
]
}
},
"overrides": []
},
"gridPos": {
"h": 3,
"w": 4,
"x": 0,
"y": 1
},
"id": 25,
"maxPerRow": 6,
"options": {
"colorMode": "value",
"graphMode": "area",
"justifyMode": "auto",
"orientation": "auto",
"reduceOptions": {
"calcs": [
"lastNotNull"
],
"fields": "",
"values": false
},
"showPercentChange": false,
"textMode": "auto",
"wideLayout": true
},
"pluginVersion": "11.1.0-69950",
"repeat": "query0",
"repeatDirection": "h",
"targets": [
{
"datasource": {
"type": "influxdb",
"uid": "ddcc45ee-bd0a-4976-856d-ce7060c3fd56"
},
"query": "SELECT sum(\"value\")\nFROM \"ElectricPowerOperations\"\nWHERE (\"type\"::tag = 'Demand')\nAND $timeFilter\nGROUP BY time($__interval) fill(previous)",
"rawQuery": true,
"refId": "A",
"resultFormat": "time_series"
}
],
"title": "$query0",
"type": "stat"
},
{
"collapsed": true,
"gridPos": {
"h": 1,
"w": 24,
"x": 0,
"y": 10
},
"id": 24,
"panels": [
{
"datasource": {
"type": "graphite",
"uid": "000000001"
},
"description": "",
"gridPos": {
"h": 2,
"w": 7,
"x": 0,
"y": 9
},
"id": 17,
"options": {
"code": {
"language": "plaintext",
"showLineNumbers": false,
"showMiniMap": false
},
"content": "# InfluxQL",
"mode": "markdown"
},
"pluginVersion": "11.1.0-69950",
"type": "text"
},
{
"datasource": {
"type": "graphite",
"uid": "000000001"
},
"description": "",
"gridPos": {
"h": 2,
"w": 7,
"x": 7,
"y": 9
},
"id": 19,
"options": {
"code": {
"language": "plaintext",
"showLineNumbers": false,
"showMiniMap": false
},
"content": "# SQL",
"mode": "markdown"
},
"pluginVersion": "11.1.0-69950",
"type": "text"
},
{
"datasource": {
"type": "graphite",
"uid": "000000001"
},
"description": "",
"gridPos": {
"h": 2,
"w": 7,
"x": 14,
"y": 9
},
"id": 18,
"options": {
"code": {
"language": "plaintext",
"showLineNumbers": false,
"showMiniMap": false
},
"content": "# Flux",
"mode": "markdown"
},
"pluginVersion": "11.1.0-69950",
"type": "text"
},
{
"datasource": {
"type": "graphite",
"uid": "000000001"
},
"gridPos": {
"h": 1,
"w": 7,
"x": 0,
"y": 11
},
"id": 14,
"links": [
{
"targetBlank": true,
"title": "",
"url": "https://play.grafana.org/goto/dDc8gqHIg?orgId=1"
}
],
"options": {
"includeVars": false,
"keepTime": false,
"maxItems": 10,
"query": "",
"showHeadings": true,
"showRecentlyViewed": false,
"showSearch": false,
"showStarred": false,
"tags": []
},
"pluginVersion": "11.1.0-69950",
"title": "More InfluxQL examples here, including variables, tables and pie charts",
"type": "dashlist"
},
{
"datasource": {
"type": "graphite",
"uid": "000000001"
},
"gridPos": {
"h": 1,
"w": 7,
"x": 7,
"y": 11
},
"id": 16,
"links": [
{
"targetBlank": true,
"title": "",
"url": "https://play.grafana.org/goto/T87ag3NIg?orgId=1"
}
],
"options": {
"includeVars": false,
"keepTime": false,
"maxItems": 10,
"query": "",
"showHeadings": true,
"showRecentlyViewed": false,
"showSearch": false,
"showStarred": false,
"tags": []
},
"pluginVersion": "11.1.0-69950",
"title": "More FlightSQL examples here, including variables, tables and pie charts",
"type": "dashlist"
},
{
"datasource": {
"type": "graphite",
"uid": "000000001"
},
"gridPos": {
"h": 1,
"w": 7,
"x": 14,
"y": 11
},
"id": 15,
"links": [
{
"targetBlank": true,
"title": "",
"url": "https://play.grafana.org/goto/6a-gk3NIR?orgId=1"
}
],
"options": {
"includeVars": false,
"keepTime": false,
"maxItems": 10,
"query": "",
"showHeadings": true,
"showRecentlyViewed": false,
"showSearch": false,
"showStarred": false,
"tags": []
},
"pluginVersion": "11.1.0-69950",
"title": "More Flux examples here, including variables, tables and pie charts",
"type": "dashlist"
},
{
"datasource": {
"type": "influxdb",
"uid": "ddcc45ee-bd0a-4976-856d-ce7060c3fd56"
},
"description": "",
"fieldConfig": {
"defaults": {
"color": {
"mode": "palette-classic"
},
"custom": {
"axisBorderShow": false,
"axisCenteredZero": false,
"axisColorMode": "text",
"axisLabel": "",
"axisPlacement": "auto",
"barAlignment": 0,
"drawStyle": "line",
"fillOpacity": 0,
"gradientMode": "none",
"hideFrom": {
"legend": false,
"tooltip": false,
"viz": false
},
"insertNulls": false,
"lineInterpolation": "linear",
"lineStyle": {
"fill": "solid"
},
"lineWidth": 1,
"pointSize": 5,
"scaleDistribution": {
"type": "linear"
},
"showPoints": "auto",
"spanNulls": false,
"stacking": {
"group": "A",
"mode": "none"
},
"thresholdsStyle": {
"mode": "off"
}
},
"mappings": [],
"thresholds": {
"mode": "absolute",
"steps": [
{
"color": "green",
"value": null
}
]
},
"unit": "mwatth"
},
"overrides": []
},
"gridPos": {
"h": 10,
"w": 7,
"x": 0,
"y": 12
},
"id": 2,
"options": {
"legend": {
"calcs": [],
"displayMode": "list",
"placement": "bottom",
"showLegend": true
},
"tooltip": {
"mode": "single",
"sort": "none"
}
},
"pluginVersion": "10.1.0-cloud.3.2a3062e8",
"targets": [
{
"datasource": {
"type": "influxdb",
"uid": "ddcc45ee-bd0a-4976-856d-ce7060c3fd56"
},
"query": "SELECT sum(\"value\") FROM \"ElectricPowerOperations\" WHERE (\"type\"::tag = 'Demand' AND \"region\"::tag =~ /(Florida|New York)/) AND $timeFilter GROUP BY region, time($__interval) fill(previous)",
"rawQuery": true,
"refId": "A",
"resultFormat": "time_series"
}
],
"title": "Hourly Demand using InfluxQL",
"transformations": [
{
"id": "renameByRegex",
"options": {
"regex": "/ElectricPowerOperations.sum { region: ([^}]+)\\}/",
"renamePattern": "$1"
}
}
],
"type": "timeseries"
},
{
"datasource": {
"type": "influxdata-flightsql-datasource",
"uid": "ef3415d2-d352-4bcf-a6ad-22fcafe2974f"
},
"description": "",
"fieldConfig": {
"defaults": {
"color": {
"mode": "palette-classic"
},
"custom": {
"axisBorderShow": false,
"axisCenteredZero": false,
"axisColorMode": "text",
"axisLabel": "",
"axisPlacement": "auto",
"barAlignment": 0,
"drawStyle": "line",
"fillOpacity": 0,
"gradientMode": "none",
"hideFrom": {
"legend": false,
"tooltip": false,
"viz": false
},
"insertNulls": false,
"lineInterpolation": "linear",
"lineWidth": 1,
"pointSize": 5,
"scaleDistribution": {
"type": "linear"
},
"showPoints": "auto",
"spanNulls": false,
"stacking": {
"group": "A",
"mode": "none"
},
"thresholdsStyle": {
"mode": "off"
}
},
"mappings": [],
"thresholds": {
"mode": "absolute",
"steps": [
{
"color": "green",
"value": null
},
{
"color": "red",
"value": 80
}
]
},
"unit": "mwatth"
},
"overrides": []
},
"gridPos": {
"h": 10,
"w": 7,
"x": 7,
"y": 12
},
"id": 3,
"options": {
"legend": {
"calcs": [],
"displayMode": "list",
"placement": "bottom",
"showLegend": true
},
"tooltip": {
"mode": "single",
"sort": "none"
}
},
"targets": [
{
"datasource": {
"type": "influxdata-flightsql-datasource",
"uid": "ef3415d2-d352-4bcf-a6ad-22fcafe2974f"
},
"format": "table",
"queryText": "SELECT * FROM \"ElectricPowerOperations\" WHERE \"type\" IN ('Demand') AND \"region\" IN ('Florida', 'New York') AND $__timeRange(time)",
"rawEditor": true,
"rawQuery": true,
"refId": "A"
}
],
"title": "Hourly Demand using FlightSQL",
"transformations": [
{
"id": "partitionByValues",
"options": {
"fields": [
"region"
]
}
},
{
"id": "renameByRegex",
"options": {
"regex": "^value\\s(.+)",
"renamePattern": "$1"
}
}
],
"type": "timeseries"
},
{
"datasource": {
"type": "datasource",
"uid": "-- Mixed --"
},
"description": "",
"fieldConfig": {
"defaults": {
"color": {
"mode": "palette-classic"
},
"custom": {
"axisBorderShow": false,
"axisCenteredZero": false,
"axisColorMode": "text",
"axisLabel": "",
"axisPlacement": "auto",
"barAlignment": 0,
"drawStyle": "line",
"fillOpacity": 0,
"gradientMode": "none",
"hideFrom": {
"legend": false,
"tooltip": false,
"viz": false
},
"insertNulls": false,
"lineInterpolation": "linear",
"lineWidth": 1,
"pointSize": 5,
"scaleDistribution": {
"type": "linear"
},
"showPoints": "auto",
"spanNulls": false,
"stacking": {
"group": "A",
"mode": "none"
},
"thresholdsStyle": {
"mode": "off"
}
},
"mappings": [],
"thresholds": {
"mode": "absolute",
"steps": [
{
"color": "green",
"value": null
},
{
"color": "red",
"value": 80
}
]
},
"unit": "mwatth"
},
"overrides": []
},
"gridPos": {
"h": 10,
"w": 7,
"x": 14,
"y": 12
},
"id": 1,
"options": {
"legend": {
"calcs": [],
"displayMode": "list",
"placement": "bottom",
"showLegend": true
},
"tooltip": {
"mode": "single",
"sort": "none"
}
},
"targets": [
{
"datasource": {
"type": "influxdb",
"uid": "play-influx-2-flux"
},
"query": "from(bucket: \"EIAtest7\")\r\n |> range(start: v.timeRangeStart, stop: v.timeRangeStop)\r\n |> filter(fn: (r) => r[\"_measurement\"] == \"ElectricPowerOperations\")\r\n |> filter(fn: (r) => r[\"_field\"] == \"value\")\r\n |> filter(fn: (r) => r[\"type\"] == \"Demand\")\r\n |> filter(fn: (r) => r[\"region\"] == \"Florida\" or r[\"region\"] == \"New York\")\r\n |> group(columns: [\"region\", \"_measurement\"], mode:\"by\") \r\n |> aggregateWindow(every: v.windowPeriod, fn: sum, createEmpty: false)\r\n |> yield(name: \"HourlyData\")",
"refId": "A"
}
],
"title": "Hourly Demand using Flux",
"type": "timeseries"
},
{
"datasource": {
"type": "influxdb",
"uid": "ddcc45ee-bd0a-4976-856d-ce7060c3fd56"
},
"description": "",
"gridPos": {
"h": 6,
"w": 7,
"x": 0,
"y": 22
},
"id": 4,
"options": {
"code": {
"language": "sql",
"showLineNumbers": false,
"showMiniMap": false
},
"content": "SELECT sum(\"value\")\r\nFROM \"ElectricPowerOperations\"\r\nWHERE (\"type\"::tag = 'Demand'\r\nAND \"region\"::tag =~ /(Florida|New York)/)\r\nAND $timeFilter\r\nGROUP BY region, time($__interval) fill(previous)",
"mode": "code"
},
"pluginVersion": "11.1.0-69950",
"title": "Query for above graph:",
"type": "text"
},
{
"datasource": {
"type": "influxdb",
"uid": "ddcc45ee-bd0a-4976-856d-ce7060c3fd56"
},
"description": "",
"gridPos": {
"h": 6,
"w": 7,
"x": 7,
"y": 22
},
"id": 6,
"options": {
"code": {
"language": "sql",
"showLineNumbers": false,
"showMiniMap": false
},
"content": "SELECT * FROM \"ElectricPowerOperations\"\r\nWHERE \"type\" IN ('Demand')\r\nAND \"region\" IN ('Florida', 'New York')\r\nAND $__timeRange(time)",
"mode": "code"
},
"pluginVersion": "11.1.0-69950",
"title": "Query for above graph:",
"type": "text"
},
{
"datasource": {
"type": "influxdb",
"uid": "ddcc45ee-bd0a-4976-856d-ce7060c3fd56"
},
"description": "",
"gridPos": {
"h": 6,
"w": 7,
"x": 14,
"y": 22
},
"id": 5,
"options": {
"code": {
"language": "sql",
"showLineNumbers": false,
"showMiniMap": false
},
"content": "from(bucket: \"EIAtest7\")\r\n |> range(start: v.timeRangeStart, stop: v.timeRangeStop)\r\n |> filter(fn: (r) => r[\"_measurement\"] == \"ElectricPowerOperations\")\r\n |> filter(fn: (r) => r[\"_field\"] == \"value\")\r\n |> filter(fn: (r) => r[\"type\"] == \"Demand\")\r\n |> filter(fn: (r) => r[\"region\"] == \"Florida\" or r[\"region\"] == \"New York\")\r\n |> group(columns: [\"region\", \"_measurement\"], mode:\"by\") \r\n |> aggregateWindow(every: v.windowPeriod, fn: sum, createEmpty: false)\r\n |> yield(name: \"HourlyData\")",
"mode": "code"
},
"pluginVersion": "11.1.0-69950",
"title": "Query for above graph:",
"type": "text"
},
{
"datasource": {
"type": "influxdb",
"uid": "ddcc45ee-bd0a-4976-856d-ce7060c3fd56"
},
"description": "",
"fieldConfig": {
"defaults": {
"color": {
"mode": "palette-classic"
},
"custom": {
"axisBorderShow": false,
"axisCenteredZero": false,
"axisColorMode": "text",
"axisLabel": "",
"axisPlacement": "auto",
"fillOpacity": 80,
"gradientMode": "none",
"hideFrom": {
"legend": false,
"tooltip": false,
"viz": false
},
"lineWidth": 1,
"scaleDistribution": {
"type": "linear"
},
"thresholdsStyle": {
"mode": "off"
}
},
"mappings": [],
"thresholds": {
"mode": "absolute",
"steps": [
{
"color": "green",
"value": null
},
{
"color": "red",
"value": 80
}
]
},
"unit": "mwatth"
},
"overrides": []
},
"gridPos": {
"h": 6,
"w": 7,
"x": 0,
"y": 28
},
"id": 8,
"options": {
"barRadius": 0,
"barWidth": 0.97,
"fullHighlight": false,
"groupWidth": 0.7,
"legend": {
"calcs": [],
"displayMode": "list",
"placement": "bottom",
"showLegend": true
},
"orientation": "auto",
"showValue": "auto",
"stacking": "none",
"tooltip": {
"mode": "single",
"sort": "none"
},
"xTickLabelRotation": 0,
"xTickLabelSpacing": 0
},
"pluginVersion": "10.1.0-cloud.3.2a3062e8",
"targets": [
{
"datasource": {
"type": "influxdb",
"uid": "ddcc45ee-bd0a-4976-856d-ce7060c3fd56"
},
"query": "SELECT sum(\"value\") FROM \"ElectricPowerOperations\" WHERE (\"type\"::tag = 'Demand' AND \"region\"::tag =~ /(Florida|New York)/) AND $timeFilter GROUP BY region, time(1d)",
"rawQuery": true,
"refId": "A",
"resultFormat": "time_series"
}
],
"title": "Daily Demand using InfluxQL",
"transformations": [
{
"id": "renameByRegex",
"options": {
"regex": "/ElectricPowerOperations.sum { region: ([^}]+)\\}/",
"renamePattern": "$1"
}
}
],
"type": "barchart"
},
{
"datasource": {
"type": "influxdata-flightsql-datasource",
"uid": "ef3415d2-d352-4bcf-a6ad-22fcafe2974f"
},
"description": "",
"fieldConfig": {
"defaults": {
"color": {
"mode": "palette-classic"
},
"custom": {
"axisBorderShow": false,
"axisCenteredZero": false,
"axisColorMode": "text",
"axisLabel": "",
"axisPlacement": "auto",
"fillOpacity": 80,
"gradientMode": "none",
"hideFrom": {
"legend": false,
"tooltip": false,
"viz": false
},
"lineWidth": 1,
"scaleDistribution": {
"type": "linear"
},
"thresholdsStyle": {
"mode": "off"
}
},
"mappings": [],
"thresholds": {
"mode": "absolute",
"steps": [
{
"color": "green",
"value": null
},
{
"color": "red",
"value": 80
}
]
},
"unit": "mwatth"
},
"overrides": []
},
"gridPos": {
"h": 6,
"w": 7,
"x": 7,
"y": 28
},
"id": 9,
"options": {
"barRadius": 0,
"barWidth": 0.97,
"fullHighlight": false,
"groupWidth": 0.7,
"legend": {
"calcs": [],
"displayMode": "list",
"placement": "bottom",
"showLegend": true
},
"orientation": "auto",
"showValue": "auto",
"stacking": "none",
"tooltip": {
"mode": "single",
"sort": "none"
},
"xTickLabelRotation": 0,
"xTickLabelSpacing": 0
},
"pluginVersion": "10.1.0-cloud.3.2a3062e8",
"targets": [
{
"columns": [
{
"value": "region"
}
],
"datasource": {
"type": "influxdata-flightsql-datasource",
"uid": "ef3415d2-d352-4bcf-a6ad-22fcafe2974f"
},
"format": "time_series",
"groupBy": "",
"limit": "",
"orderBy": "",
"queryText": "SELECT date_Bin(INTERVAL '1 day', time, TIMESTAMP '1970-01-01 00:00:00Z') AS time, sum(\"value\") AS sum_value, region\n FROM \"ElectricPowerOperations\" WHERE \"type\" IN ('Demand') AND \"region\" IN ('Florida', 'New York') AND $__timeRange(time) GROUP BY 1, region\n ORDER BY time ASC",
"rawEditor": true,
"rawQuery": true,
"refId": "A",
"table": "\"ElectricPowerOperations\"",
"wheres": [
{
"value": ""
}
]
}
],
"title": "Daily Demand using FlightSQL",
"transformations": [
{
"id": "renameByRegex",
"options": {
"regex": "^sum_value\\s(.+)",
"renamePattern": "$1"
}
}
],
"type": "barchart"
},
{
"datasource": {
"type": "influxdb",
"uid": "play-influx-2-flux"
},
"description": "",
"fieldConfig": {
"defaults": {
"color": {
"mode": "palette-classic"
},
"custom": {
"axisBorderShow": false,
"axisCenteredZero": false,
"axisColorMode": "text",
"axisLabel": "",
"axisPlacement": "auto",
"fillOpacity": 80,
"gradientMode": "none",
"hideFrom": {
"legend": false,
"tooltip": false,
"viz": false
},
"lineWidth": 1,
"scaleDistribution": {
"type": "linear"
},
"thresholdsStyle": {
"mode": "off"
}
},
"mappings": [],
"thresholds": {
"mode": "absolute",
"steps": [
{
"color": "green",
"value": null
},
{
"color": "red",
"value": 80
}
]
},
"unit": "mwatth"
},
"overrides": [
{
"matcher": {
"id": "byName",
"options": "Time"
},
"properties": [
{
"id": "unit",
"value": "MM:DD:YYYY"
}
]
}
]
},
"gridPos": {
"h": 6,
"w": 7,
"x": 14,
"y": 28
},
"id": 10,
"options": {
"barRadius": 0,
"barWidth": 0.97,
"fullHighlight": false,
"groupWidth": 0.7,
"legend": {
"calcs": [],
"displayMode": "list",
"placement": "bottom",
"showLegend": true
},
"orientation": "auto",
"showValue": "auto",
"stacking": "none",
"tooltip": {
"mode": "single",
"sort": "none"
},
"xTickLabelRotation": 0,
"xTickLabelSpacing": 0
},
"pluginVersion": "10.0.3-cloud.2.14737d80",
"targets": [
{
"datasource": {
"type": "influxdb",
"uid": "play-influx-2-flux"
},
"query": "from(bucket: \"EIAtest7\")\r\n |> range(start: v.timeRangeStart, stop: v.timeRangeStop)\r\n |> filter(fn: (r) => r[\"_measurement\"] == \"ElectricPowerOperations\")\r\n |> filter(fn: (r) => r[\"_field\"] == \"value\")\r\n |> filter(fn: (r) => r[\"type\"] == \"Demand\" )\r\n |> filter(fn: (r) => r[\"region\"] == \"Florida\" or r[\"region\"] == \"New York\")\r\n |> group(columns: [\"region\", \"_measurement\"], mode:\"by\") \r\n |> aggregateWindow(every: 1d, fn: sum, timeSrc:\"_start\") // sums the total used per day\r\n |> yield(name: \"DailyData\")",
"refId": "A"
}
],
"title": "Daily Demand using Flux",
"transformations": [
{
"id": "renameByRegex",
"options": {}
}
],
"type": "barchart"
},
{
"datasource": {
"type": "influxdb",
"uid": "ddcc45ee-bd0a-4976-856d-ce7060c3fd56"
},
"description": "",
"gridPos": {
"h": 6,
"w": 7,
"x": 0,
"y": 34
},
"id": 11,
"options": {
"code": {
"language": "sql",
"showLineNumbers": false,
"showMiniMap": false
},
"content": "SELECT sum(\"value\")\r\nFROM \"ElectricPowerOperations\"\r\nWHERE (\"type\"::tag = 'Demand'\r\nAND \"region\"::tag =~ /(Florida|New York)/)\r\nAND $timeFilter\r\nGROUP BY region, time(1d)",
"mode": "code"
},
"pluginVersion": "11.1.0-69950",
"title": "Query for above graph:",
"type": "text"
},
{
"datasource": {
"type": "influxdb",
"uid": "ddcc45ee-bd0a-4976-856d-ce7060c3fd56"
},
"description": "",
"gridPos": {
"h": 6,
"w": 7,
"x": 7,
"y": 34
},
"id": 13,
"options": {
"code": {
"language": "sql",
"showLineNumbers": false,
"showMiniMap": false
},
"content": "SELECT date_Bin(INTERVAL '1 day', time, TIMESTAMP '1970-01-01 00:00:00Z')\r\nAS time, sum(\"value\")\r\nAS sum_value, region\r\n FROM \"ElectricPowerOperations\"\r\n WHERE \"type\" IN ('Demand') AND \"region\" IN ('Florida', 'New York')\r\n AND $__timeRange(time)\r\n GROUP BY 1, region\r\n ORDER BY time ASC",
"mode": "code"
},
"pluginVersion": "11.1.0-69950",
"title": "Query for above graph:",
"type": "text"
},
{
"datasource": {
"type": "influxdb",
"uid": "ddcc45ee-bd0a-4976-856d-ce7060c3fd56"
},
"description": "",
"gridPos": {
"h": 6,
"w": 7,
"x": 14,
"y": 34
},
"id": 12,
"options": {
"code": {
"language": "sql",
"showLineNumbers": false,
"showMiniMap": false
},
"content": "from(bucket: \"EIAtest7\")\r\n |> range(start: v.timeRangeStart, stop: v.timeRangeStop)\r\n |> filter(fn: (r) => r[\"_measurement\"] == \"ElectricPowerOperations\")\r\n |> filter(fn: (r) => r[\"_field\"] == \"value\")\r\n |> filter(fn: (r) => r[\"type\"] == \"Demand\" )\r\n |> filter(fn: (r) => r[\"region\"] == \"Florida\" or r[\"region\"] == \"New York\")\r\n |> group(columns: [\"region\", \"_measurement\"], mode:\"by\") \r\n |> aggregateWindow(every: 1d, fn: sum, timeSrc:\"_start\")\r\n |> yield(name: \"DailyData\")",
"mode": "code"
},
"pluginVersion": "11.1.0-69950",
"title": "Query for above graph:",
"type": "text"
},
{
"datasource": {
"type": "influxdata-flightsql-datasource",
"uid": "ef3415d2-d352-4bcf-a6ad-22fcafe2974f"
},
"description": "",
"fieldConfig": {
"defaults": {
"color": {
"mode": "continuous-GrYlRd"
},
"mappings": [],
"min": 0,
"thresholds": {
"mode": "absolute",
"steps": [
{
"color": "green",
"value": null
}
]
},
"unit": "mwatth"
},
"overrides": []
},
"gridPos": {
"h": 8,
"w": 7,
"x": 7,
"y": 40
},
"id": 21,
"options": {
"displayMode": "gradient",
"maxVizHeight": 300,
"minVizHeight": 10,
"minVizWidth": 0,
"namePlacement": "auto",
"orientation": "vertical",
"reduceOptions": {
"calcs": [],
"fields": "/^value \\(mean\\)$/",
"values": true
},
"showUnfilled": true,
"sizing": "auto",
"valueMode": "color"
},
"pluginVersion": "11.1.0-69950",
"targets": [
{
"columns": [
{
"value": "region"
}
],
"datasource": {
"type": "influxdata-flightsql-datasource",
"uid": "ef3415d2-d352-4bcf-a6ad-22fcafe2974f"
},
"format": "table",
"groupBy": "",
"limit": "",
"orderBy": "",
"queryText": "SELECT\n EXTRACT(HOUR FROM \"time\") AS hour,\n \"region\",\n \"time\",\n \"type\",\n \"value\"\nFROM \"ElectricPowerOperations\"\nWHERE\n $__timeRange(time)\n AND\n \"value\" IS NOT NULL\n AND\n \"region\" = 'Florida'\n AND \"type\" = 'Demand'\nGROUP BY hour, \"region\", \"time\", \"type\", \"value\"\nORDER BY hour;",
"rawEditor": true,
"rawQuery": true,
"refId": "A",
"table": "\"ElectricPowerOperations\"",
"wheres": [
{
"value": ""
}
]
}
],
"title": "Average Demand by Hour of Day using SQL",
"transformations": [
{
"id": "groupBy",
"options": {
"fields": {
"hour": {
"aggregations": [],
"operation": "groupby"
},
"value": {
"aggregations": [
"mean"
],
"operation": "aggregate"
}
}
}
},
{
"id": "convertFieldType",
"options": {
"conversions": [
{
"destinationType": "string",
"targetField": "hour"
}
],
"fields": {}
}
}
],
"type": "bargauge"
},
{
"datasource": {
"type": "influxdb",
"uid": "play-influx-2-flux"
},
"description": "",
"fieldConfig": {
"defaults": {
"color": {
"mode": "continuous-GrYlRd"
},
"mappings": [],
"min": 0,
"thresholds": {
"mode": "absolute",
"steps": [
{
"color": "green",
"value": null
},
{
"color": "red",
"value": 80
}
]
},
"unit": "mwatth"
},
"overrides": []
},
"gridPos": {
"h": 8,
"w": 7,
"x": 14,
"y": 40
},
"id": 20,
"options": {
"displayMode": "gradient",
"maxVizHeight": 300,
"minVizHeight": 10,
"minVizWidth": 0,
"namePlacement": "auto",
"orientation": "vertical",
"reduceOptions": {
"calcs": [],
"fields": "",
"values": true
},
"showUnfilled": true,
"sizing": "auto",
"valueMode": "color"
},
"pluginVersion": "11.1.0-69950",
"targets": [
{
"datasource": {
"type": "influxdb",
"uid": "play-influx-2-flux"
},
"query": "import \"date\"\r\n\r\nfrom(bucket: \"EIAtest7\")\r\n |> range(start: v.timeRangeStart, stop: v.timeRangeStop)\r\n |> filter(fn: (r) => r[\"_measurement\"] == \"ElectricPowerOperations\")\r\n |> filter(fn: (r) => r[\"_field\"] == \"value\")\r\n |> filter(fn: (r) => r[\"type\"] == \"Demand\")\r\n |> filter(fn: (r) => r[\"region\"] == \"Florida\")\r\n |> group(columns: [\"region\", \"_measurement\"], mode:\"by\") \r\n |> aggregateWindow(every: 1h, fn: mean, createEmpty: false)\r\n |> timeShift(duration: -1h)\r\n |> map(fn: (r) => ({ r with hour: date.hour(t: r._time) })) \r\n |> group(columns: [\"hour\"], mode:\"by\")\r\n |> mean(column: \"_value\") \r\n |> group()\r\n |> sort(columns: [\"hour\"])",
"refId": "A"
}
],
"title": "Average Demand by Hour of Day using Flux",
"transformations": [
{
"id": "convertFieldType",
"options": {
"conversions": [
{
"destinationType": "string",
"targetField": "hour"
}
],
"fields": {}
}
}
],
"type": "bargauge"
},
{
"datasource": {
"type": "influxdb",
"uid": "ddcc45ee-bd0a-4976-856d-ce7060c3fd56"
},
"description": "",
"gridPos": {
"h": 6,
"w": 7,
"x": 7,
"y": 48
},
"id": 23,
"options": {
"code": {
"language": "sql",
"showLineNumbers": false,
"showMiniMap": false
},
"content": "SELECT\r\n EXTRACT(HOUR FROM \"time\") AS hour,\r\n \"region\",\r\n \"time\",\r\n \"type\",\r\n \"value\"\r\nFROM \"ElectricPowerOperations\"\r\nWHERE\r\n $__timeRange(time)\r\n AND\r\n \"value\" IS NOT NULL\r\n AND\r\n \"region\" = 'Florida'\r\n AND \"type\" = 'Demand'\r\nGROUP BY hour, \"region\", \"time\", \"type\", \"value\"\r\nORDER BY hour;",
"mode": "code"
},
"pluginVersion": "11.1.0-69950",
"title": "Query for above graph:",
"type": "text"
},
{
"datasource": {
"type": "influxdb",
"uid": "ddcc45ee-bd0a-4976-856d-ce7060c3fd56"
},
"description": "",
"gridPos": {
"h": 6,
"w": 7,
"x": 14,
"y": 48
},
"id": 22,
"options": {
"code": {
"language": "sql",
"showLineNumbers": false,
"showMiniMap": false
},
"content": "import \"date\"\r\n\r\nfrom(bucket: \"EIAtest7\")\r\n |> range(start: v.timeRangeStart, stop: v.timeRangeStop)\r\n |> filter(fn: (r) => r[\"_measurement\"] == \"ElectricPowerOperations\")\r\n |> filter(fn: (r) => r[\"_field\"] == \"value\")\r\n |> filter(fn: (r) => r[\"type\"] == \"Demand\")\r\n |> filter(fn: (r) => r[\"region\"] == \"Florida\")\r\n |> group(columns: [\"region\", \"_measurement\"], mode:\"by\") \r\n |> aggregateWindow(every: 1h, fn: mean, createEmpty: false)\r\n |> timeShift(duration: -1h)\r\n |> map(fn: (r) => ({ r with hour: date.hour(t: r._time) })) \r\n |> group(columns: [\"hour\"], mode:\"by\")\r\n |> mean(column: \"_value\") \r\n |> group()\r\n |> sort(columns: [\"hour\"])",
"mode": "code"
},
"pluginVersion": "11.1.0-69950",
"title": "Query for above graph:",
"type": "text"
}
],
"title": "Row title",
"type": "row"
}
],
"refresh": "",
"schemaVersion": 39,
"tags": [
"ds-example"
],
"templating": {
"list": [
{
"current": {
"selected": true,
"text": [
"California",
"Carolinas",
"Central",
"Florida",
"Mid-Atlantic",
"Midwest",
"New England",
"New York",
"Northwest",
"Southeast",
"Southwest",
"Tennessee",
"Texas"
],
"value": [
"California",
"Carolinas",
"Central",
"Florida",
"Mid-Atlantic",
"Midwest",
"New England",
"New York",
"Northwest",
"Southeast",
"Southwest",
"Tennessee",
"Texas"
]
},
"datasource": {
"type": "influxdb",
"uid": "ddcc45ee-bd0a-4976-856d-ce7060c3fd56"
},
"definition": "SHOW TAG VALUES FROM ElectricPowerOperations WITH KEY =~ /region/",
"hide": 0,
"includeAll": true,
"multi": true,
"name": "query0",
"options": [],
"query": "SHOW TAG VALUES FROM ElectricPowerOperations WITH KEY =~ /region/",
"refresh": 1,
"regex": "",
"skipUrlSync": false,
"sort": 0,
"type": "query"
}
]
},
"time": {
"from": "now-7d",
"to": "now"
},
"timeRangeUpdatedDuringEditOrView": false,
"timepicker": {},
"timezone": "",
"title": "6 - Influx: Bar Charts and Time Series using Mixed queries",
"uid": "dea43745-7fac-4bf4-85d0-d06b168de92b",
"version": 59,
"weekStart": ""
}