Hi there!
I’m trying to create a state timeline panel that should show the time and state where my gaz boiler’s circulation pump switched on and probably switched off.
Using Grafana 9.1.0 and InfluxDB 2.2 with FluxQL!
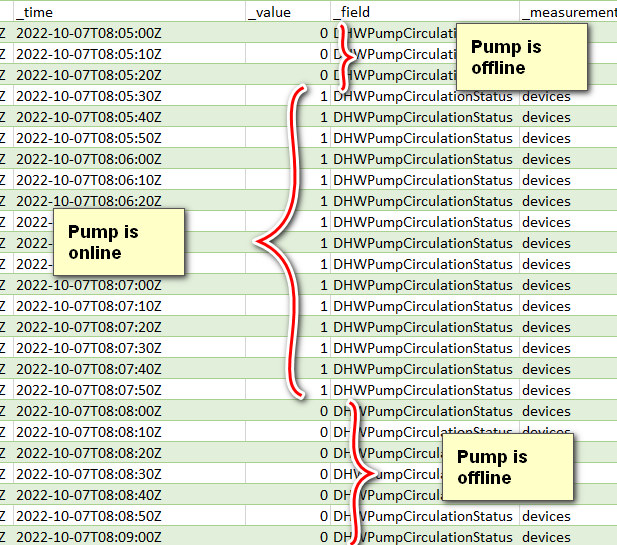
Basically I’ve got the following datasource (simplified for the current question):
Right now I’m using this query:
from(bucket: "viessmann")
  |> range(start: v.timeRangeStart, stop: v.timeRangeStop)
  |> filter(fn: (r) => r["_measurement"] == "devices")
  |> filter(fn: (r) => r["_field"] == "DHWPumpCirculationStatus")
  |> aggregateWindow(every: v.windowPeriod, fn: last, createEmpty: true)
  |> yield(name: "last")
and the chart I’m expecting should look like this. OTH, maybe a state timeline is not the best choice.
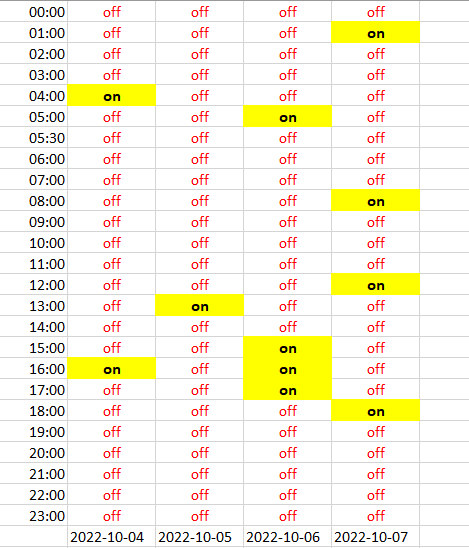
The time slices on the left side are just examples, however, slots of 1 hour or maybe 30 minutes are desired.
So how can I create such a panel if at all?
Thanks for any advice,
Michael

