Hello,
it seems that my syslog data from a firewall is not reliable shown in a graph. It’s “jumping”, and I can’t find out what’s wrong.
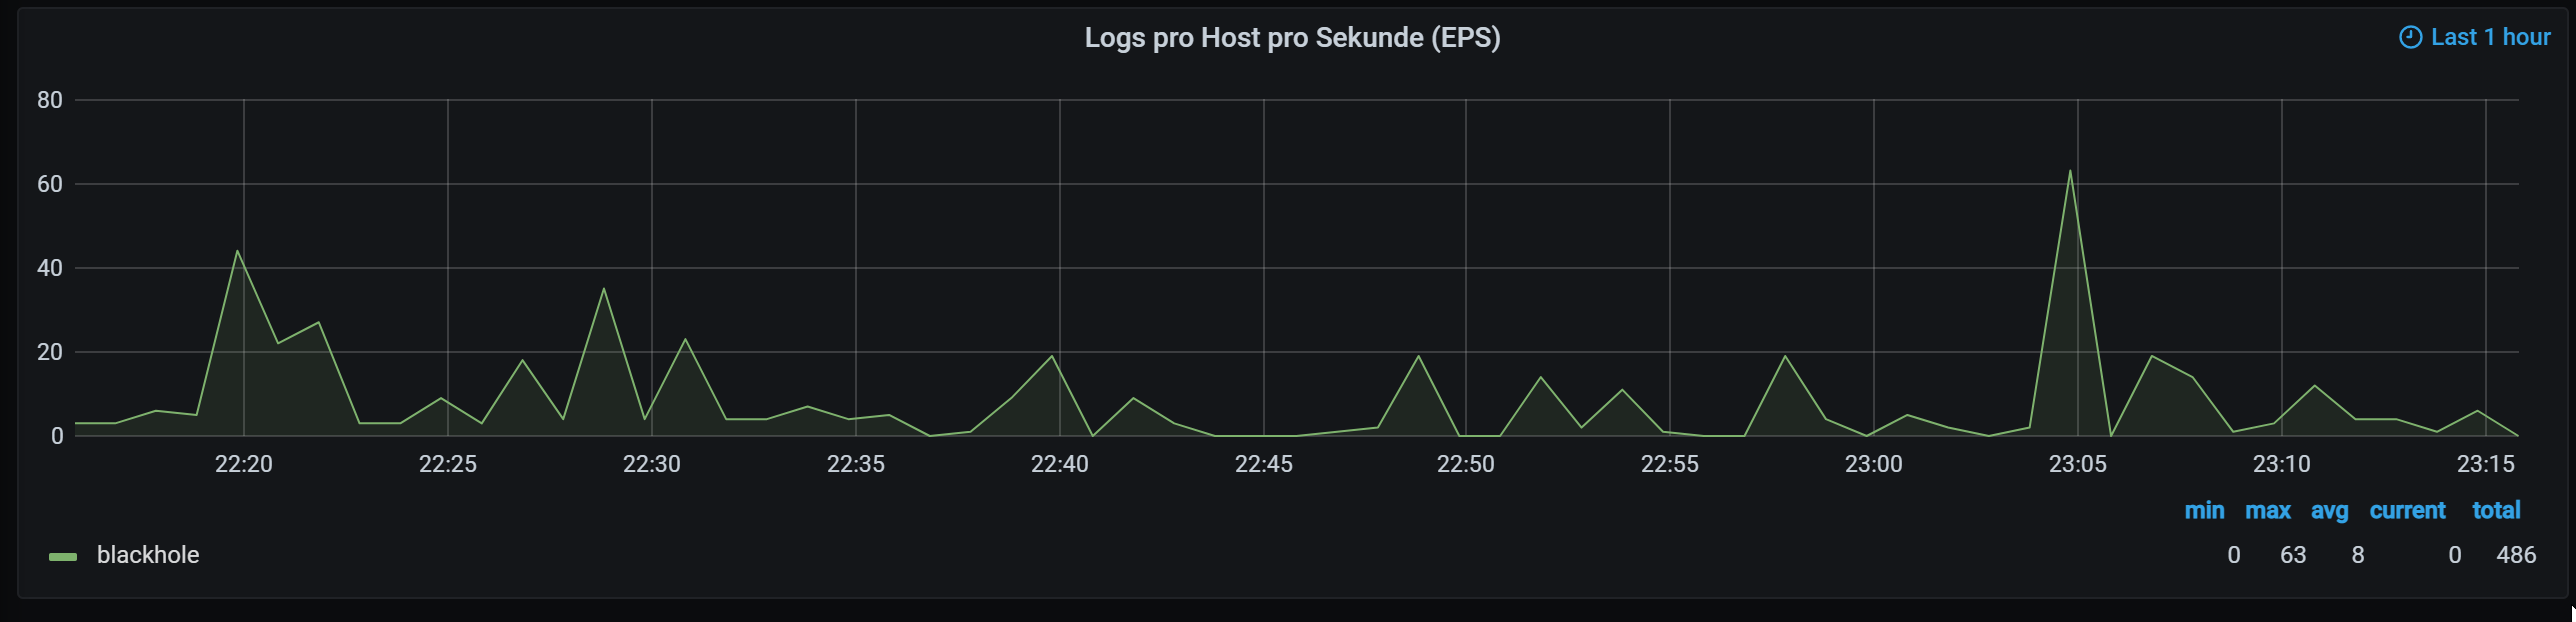
This three screenshots are 5 seconds apart from each other:

(Sorry, new users are only allowed two media files)
Exact same day and time (+/-15 seconds). Just completely different “data” every 5 seconds (it seems that Grafana is “cycling” through 3-4 versions of the data).
My Query is:
sum by (host) (count_over_time({job="syslog"}[1s]))
It doesn’t make a difference if I use different time range (last 1h, last 6h, last 24h…), if I update manually (or automatically every 5 seconds) nor if I putting it on a separate new dashboard (see JSON at the bottom).
Same stuff (“jumping graphs”) happens also to other queries, like:
count_over_time({job="syslog"}[1s] |= "-A]")
Example Log-Line:
[LAN_LOCAL-default-A]IN=eth1.1 OUT=eth1.2 MAC=ff:ff:ff:ff:ff:ff:dc:b6:33:41:a4:52:07:01:55:10:01:41 SRC=192.168.0.2 DST=255.255.255.255 LEN=147 TOS=0x00 PREC=0x00 TTL=64 ID=4795 DF PROTO=UDP SPT=53502 DPT=1900 LEN=127
Systeminfo:
- Raspberry Pi 4 Model B Rev 1.2 (4GB, arm, non-64bit)
- Raspbian GNU/Linux 10 (buster)
- Docker version 20.10.5, build 55c4c88
- Grafana v7.5.2 (ca413c612f)
- Promtail: Version=master-4d1da2e, branch=master, revision=4d1da2ed
- Loki Version unkown (should be a couple of days old, with docker pull)
- Logs are received from a local rsyslog (which receive them from the firewall)
I’m starting the “whole Grafana Stuff” with docker-compose.yml:
version: "2"
services:
  influxdb:
    image: influxdb:1.8 #armv7
    container_name: influxdb
    restart: always
    ports:
      - "8083:8083"
      - "8086:8086"
      - "8090:8090"
    env_file:
      - 'env.influxdb'
    volumes:
      - ./influxdb/data:/var/lib/influxdb

  telegraf:
    image: telegraf:latest
    container_name: telegraf
    restart: always
    links:
      - influxdb
    volumes:
      - ./telegraf.conf:/etc/telegraf/telegraf.conf:ro

  loki:
    image: grafana/loki:latest
    container_name: loki
    ports:
      - "3100:3100"
    volumes:
      - ./loki-local-config.yaml:/etc/loki/local-config.yaml:ro
    command: -config.file=/etc/loki/local-config.yaml

  promtail:
    image: grafana/promtail:latest
    container_name: promtail
    ports:
      - "1514:1514"
    volumes:
      - ./promtail:/var/log
      - ./promtail-docker-config.yaml:/etc/promtail/config.yml:ro
    command: -config.file=/etc/promtail/config.yml

  grafana:
    image: grafana/grafana:latest
    container_name: grafana
    restart: always
    ports:
      - "3001:3000"
    env_file:
      - 'env.grafana'
    user: "0"
    links:
      - influxdb
    volumes:
      - ./grafana/data:/var/lib/grafana
My JSON Model of a Dashboard with this Graph is:
{
  "annotations": {
    "list": [
      {
        "builtIn": 1,
        "datasource": "-- Grafana --",
        "enable": true,
        "hide": true,
        "iconColor": "rgba(0, 211, 255, 1)",
        "name": "Annotations & Alerts",
        "type": "dashboard"
      }
    ]
  },
  "editable": true,
  "gnetId": null,
  "graphTooltip": 0,
  "id": null,
  "links": [],
  "panels": [
    {
      "aliasColors": {},
      "bars": false,
      "dashLength": 10,
      "dashes": false,
      "datasource": "Loki",
      "decimals": 0,
      "fieldConfig": {
        "defaults": {
          "unit": "short"
        },
        "overrides": []
      },
      "fill": 1,
      "fillGradient": 0,
      "gridPos": {
        "h": 8,
        "w": 24,
        "x": 0,
        "y": 0
      },
      "hiddenSeries": false,
      "id": 2,
      "interval": "1m",
      "legend": {
        "alignAsTable": true,
        "avg": true,
        "current": true,
        "max": true,
        "min": true,
        "show": true,
        "total": true,
        "values": true
      },
      "lines": true,
      "linewidth": 1,
      "nullPointMode": "null as zero",
      "options": {
        "alertThreshold": true
      },
      "percentage": false,
      "pluginVersion": "7.5.2",
      "pointradius": 2,
      "points": false,
      "renderer": "flot",
      "seriesOverrides": [],
      "spaceLength": 10,
      "stack": false,
      "steppedLine": false,
      "targets": [
        {
          "expr": "sum by (host) (count_over_time({job=\"syslog\"}[1s]))",
          "instant": false,
          "legendFormat": "{{host}}",
          "range": true,
          "refId": "A"
        }
      ],
      "thresholds": [],
      "timeFrom": "1h",
      "timeRegions": [],
      "timeShift": null,
      "title": "Logs pro Host pro Sekunde (EPS)",
      "tooltip": {
        "shared": true,
        "sort": 0,
        "value_type": "individual"
      },
      "type": "graph",
      "xaxis": {
        "buckets": null,
        "mode": "time",
        "name": null,
        "show": true,
        "values": []
      },
      "yaxes": [
        {
          "$$hashKey": "object:1497",
          "decimals": 0,
          "format": "short",
          "label": "",
          "logBase": 1,
          "max": null,
          "min": "0",
          "show": true
        },
        {
          "$$hashKey": "object:1498",
          "format": "short",
          "label": null,
          "logBase": 1,
          "max": null,
          "min": null,
          "show": false
        }
      ],
      "yaxis": {
        "align": false,
        "alignLevel": null
      }
    }
  ],
  "schemaVersion": 27,
  "style": "dark",
  "tags": [],
  "templating": {
    "list": []
  },
  "time": {
    "from": "now-6h",
    "to": "now"
  },
  "timepicker": {},
  "timezone": "",
  "title": "New dashboard",
  "uid": null,
  "version": 0
}
Does anyone haven an Idea what’s wrong and how I could fix this including for all of my other Syslog+Promtail+Loki Panels?
Thank you very much.
Regards, Jens