Hi, Community! Seeking for the advise on the following problem: I need to configure Grafana alerting to Kafka
Initial configuration:
-
Deployed Kube-prometheus stack for K8s cluster monitoring
-
Used helm chart of the latest version - link
Out of the box there are banch of predefined alert rules in Grafana. And the main idea is to force Grafana to send these "out-of-the-box"alerts to Kafka
Here is the basic configuration added to Grafana chart:
alerting:
  contactpoints.yaml:
   apiVersion: 1
   contactPoints:
     - orgId: 1
       name: kafka
       receivers:
         - uid: kafka1
           type: kafka
           is_default: true
           settings:
              kafkaRestProxy: http://k8s_service_url.k8s_namespace:8082
              kafkaTopic: monitoring-alerts
  policies.yaml:
    apiVersion: 1
    policies:
      - orgId: 1
        receiver: kafka
        group_by: ['...']
        matchers:
          - severity =~ "warning|critical"
        group_wait: 30s
        group_interval: 5m
        repeat_interval: 4h
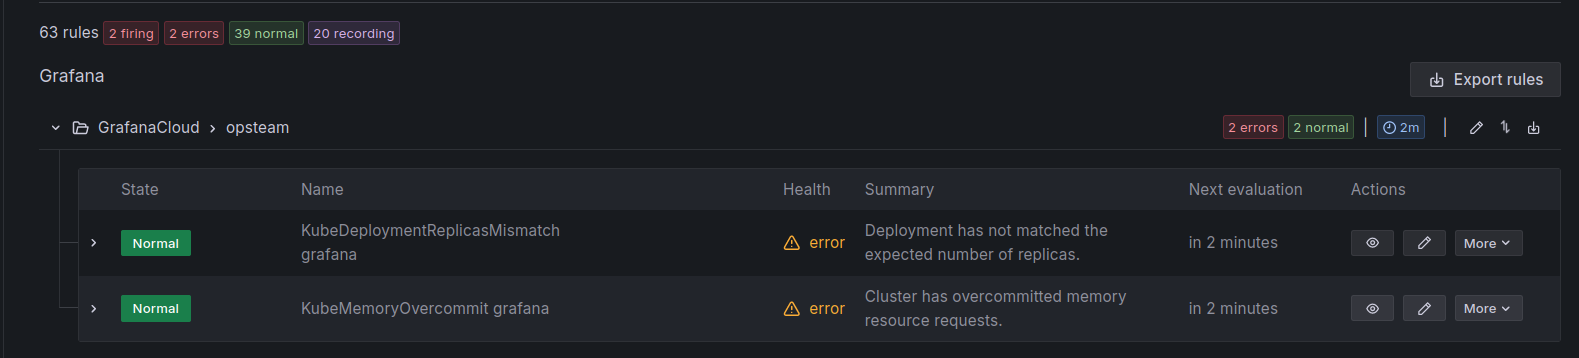
After deployng of the stack and some time for evaluation, there are several alerts firing with bunch of labels (warning|critical are present):
Broken nginx deployment for testing purpose:

Eventually, as a result, none of these alarms are NOT sent to Kafka.
BUT, at the same time:
If I duplicate some random exitsting rule and create it manually, alerting is working fine for this rule.
Here is what is sending to Kafka, as an example:

Sumarizing:
- Conection to Kafka is working
- Manually created alerts are routing properly to Kafka
- Out-of-the-box alerts at the same time are NOT sent to Kafka
Could someone advise the direction to dig in???