Hello,
Suppose we have a “Table view” that looks like this:
| Key |
Value |
| 500 |
0.462 |
| 1000 |
0.418 |
| 1500 |
0.382 |
| 2500 |
0.198 |
| 3000 |
0.167 |
You’ll notice that if we want entries for every increment of 500 in the key, then the key 2000 is missing from the table. The increment value is defined by a dashboard variable.
Is there a way to populate the table, possibly through a transformation, so that missing keys are added and assigned a value of 0?
The reason for this request is to create a bar chart representation that isn’t skewed by missing information. I’m also open to any other suggestions you might have to tackle this issue.
I think that should be solved on the query level, e.g. union/join real result set with set of zeroes - so result set will have key with zero, for keys which are missing in real result set.
1 Like
Thank you for your reply.
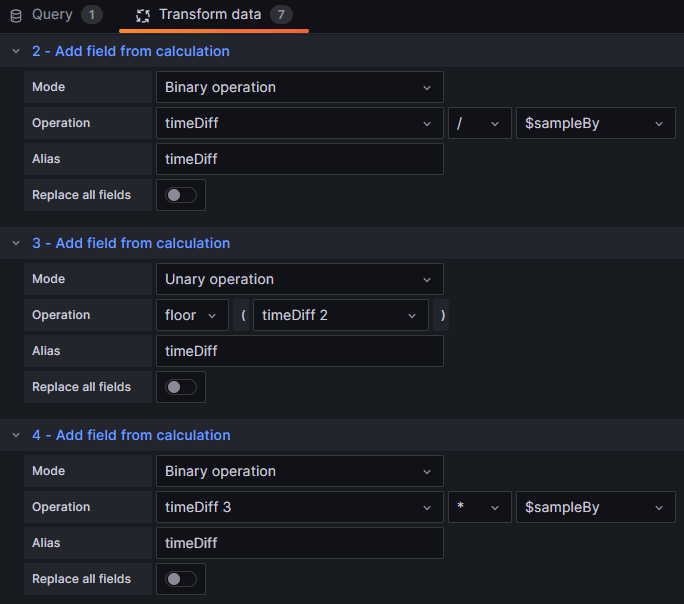
The issue I perceive with that solution is that the queried data has a granularity of 1. By applying transformations, I am sampling the data so that it is grouped by a dashboard variable (i.e., the increment range) which in turn increases the granularity.
Can I generate a table of 0s from a query or insert values in the table?
Use test datasource type - where you can generate static data for your need (e.g. csv)
If so how did you arrive to the increments of 500 on your first example?
Please share query that grouped data in 500 buckets
What is your datasource
Data is sampled at an interval of 500 due to transformations.
1 Like
what is your data source?
@yosiasz does the fact that it’s InfluxDB change anything?