Hello,
I am using the plotly plugin by nLine, I wanted to know if it supports all the features that would be present in the react js version. I have followed the plugin’s documentation and replicated the data object, the layout object and the config object as much as possible but the results look very different when comparing the output I got when rendering it in my react project and the output I got when rendering it with the plugin in my dashboard. When I tried to add a camera object in my layout, the graph did not change its orientation and remained the same and also the grid lines and legend is not being disabled as it would be in my react project. When ever I save the panel with the camera object it disappears from the layout text editor box. Also the color is not rendering as intended(its rendering a darker shade of the color). Can anyone suggest a better plugin that I can use or correct me if I have made a mistake in the implementation.
for reference this is my data array object in react :
data = [
{
type: “mesh3d”,
x: pointCloudDatas.points[0].x,
y: pointCloudDatas.points[0].y,
z: pointCloudDatas.points[0].z,
color: “#FFBA52FF”,
showlegend: false,
legendgroup: “Volume Filled”,
name: “Volume Filled”,
},
{
type: “scatter3d”,
x: pointCloud[0],
y: pointCloud[1],
z: pointCloud[2],
mode: “markers”,
marker: {
size: 2,
color: “#FFBA52FF”,
showlegend: false,
legendgroup: “Volume Filled”,
},
color: “#FFBA52FF”,
showlegend: false,
legendgroup: “Volume Filled”,
name: “Volume Filled”,
},
{
type: “surface”,
x: createNestedArray(surfaceData.CPx, chunkSize),
y: createNestedArray(surfaceData.CPy, chunkSize),
z: createNestedArray(surfaceData.CPz, chunkSize),
colorscale: [
[0, “rgb(75,75,75)”],
[1, “rgb(75,75,75)”],
],
// opacity: 0.5,
showscale: false,
showlegend: false,
legendgroup: “Silo”,
name: “Silo”,
},
{
type: “surface”,
x: createNestedArray(surfaceData.Xco2, chunkSize),
y: createNestedArray(surfaceData.Yco2, chunkSize),
z: createNestedArray(surfaceData.Zco2, chunkSize),
colorscale: [
[0, “rgb(75,75,75)”],
[1, “rgb(75,75,75)”],
],
opacity: 0.5,
showscale: false,
showlegend: false,
legendgroup: “Silo”,
name: “Silo”,
},
{
type: “surface”,
x: (createNestedArray(surfaceData.Xc, chunkSize)),
y: (createNestedArray(surfaceData.Yc, chunkSize)),
z: (createNestedArray(surfaceData.Zc, chunkSize)),
colorscale: [
[0, “rgb(75,75,75)”],
[1, “rgb(75,75,75)”],
],
opacity: 0.5,
showscale: false,
showlegend: false,
legendgroup: “Silo”,
name: “Silo”,
},
{
type: “surface”,
x: (createNestedArray(surfaceData.Xc2, chunkSize)),
y: (createNestedArray(surfaceData.Yc2, chunkSize)),
z: (createNestedArray(surfaceData.Zc2, chunkSize)),
colorscale: [
[0, “rgb(75,75,75)”],
[1, “rgb(75,75,75)”],
],
opacity: 0.5,
showscale: false,
showlegend: false,
legendgroup: “Silo”,
name: “Silo”,
}
];
this is my layout object in react : const layout = {
scene: {
xaxis: {
autorange: true,
visible: false,
},
yaxis: {
autorange: true,
visible: false,
},
zaxis: {
autorange: true,
visible: false,
},
camera: {,
center: {x: 0, y: 0, z: 0},
eye: {x: 2, y: 2, z: -0.1},
up: {x: 1.2, y: 1.2, z: -1.2} },
dragmode: “orbit”,
},
margin: {
l: 0,
r: 0,
b: 0,
t: 0,
pad: 0
}
height: 700,
width: 550,
paper_bgcolor: “#f0f2f5”,
// plot_bgcolor: “rgba(0,0,0,0)”,
};
this is my config object in react : const config = {
displayModeBar: false,
scrollZoom: false,
autosize: false,
responsive: true
};
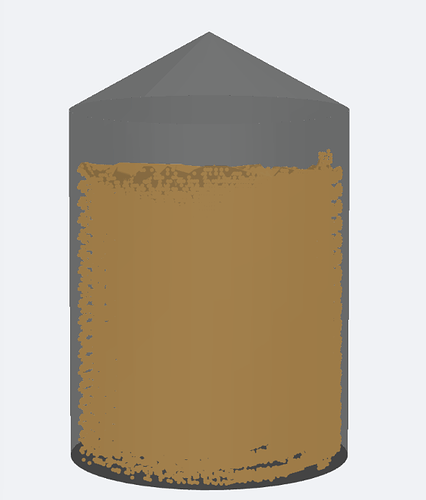
which will give me an out like this :
Using the plugin I cannot show the data object because it is way too big but I have replicated it as much as possible. The data style is : - colorscale:
- - 0
- rgb(75,75,75)
- - 1
- rgb(75,75,75)
showlegend: false
showscale: false
type: surface
- colorscale:
-
- 0
- rgb(75,75,75)
-
- 1
- rgb(75,75,75)
showlegend: false
showscale: false
type: surface
-
- colorscale:
-
- 0
- rgb(75,75,75)
-
- 1
- rgb(75,75,75)
showlegend: false
showscale: false
type: surface
-
- colorscale:
-
- 0
- rgb(75,75,75)
-
- 1
- rgb(75,75,75)
showlegend: false
showscale: false
type: surface
-
- color: ‘#FFBA52FF’
showlegend: false
type: mesh3d - color: ‘#FFBA52FF’
showlegend: false
type: scatter3d
and the layout is : font:
family: Inter, Helvetica, Arial, sans-serif
color: rgb(25,27,31)
paper_bgcolor: white
plot_bgcolor: white
hoverlabel:
bgcolor: white
margin:
t: 30
r: 30
b: 30
l: 30
xaxis:
type: date
autorange: true
automargin: true
yaxis:
automargin: true
autorange: true
and the config is : autosize: false
displayModeBar: false
responsive: true
scrollZoom: false
which is giving me an output in the panel like this :

from a different prespective it looks like this :

