Hello, Everyone,
I’m Running OpenStack private cloud so I want to monitor the performance of OpenStack cloud with grafana. So, for this, I installed graphite in one machine and collectd in another machine where OpenStack is running and added data source graphite in grafana dashboard but when I import dashboard of OpenStack general system performance I’m getting no data points. So, anything is missing or is there any way to get OpenStack performance with grafana …pls help me out…thank you in advance…
Hi! Not sure, did you set up your collectors right? Do you have any OpenStack-related metrics in your Graphite?
I installed collectd in openstack machine so that it collect data of openstack services and send to graphite…and openstack metrics i have is available in collectd where i edited many plugins in collectd.conf
pls reply for clarification sir
if you open a graph in edit mode, using the graphite query editor you can explore the metric name space. Do you have any open stack metrics there?
Yes …I’m getting openstack metrics in query editor when i open graph in edit mode and if i set metric manually i can see some data for few metrics not all but i need to load all data automatically without setting it manually because i did grafana for only mysql and at that time all data loaded automatically after restart of collectd services and as soon as import dashboard all data was showing up. So, I wanted to load all data automatically…pls help me or is something is missing out…??
This sentence is very hard to understand. Could you rephrase it to help us understand your problem.
Hi danielle sir…currently i’m running one openstack private cloud. So, I want to monitor cloud using grafana tool and grafana gives dashboard called OpenStack general system performance. So, I prepared setup like installing graphite in one machine and collectd in openstack machine and when I import dashboard its showing no data points but when I open graph in edit mode with query editor I can find openstack metrics and if I set metrics, graph shows single metric data. So, I want all metric should work without setting metrics manaully in edit mode. Few days back I imported another dashboard called MYSQL service, for MYSQL I was getting all metrics as soon as I imported dashboard. So, for openstack graph showing no data points…Pls help me out …Thank You in advance…
I still do not understand. Is the query wrong when you open it in edit mode and you have to change it to be correct again?
Can you show a screenshot with the dashboard before and after.
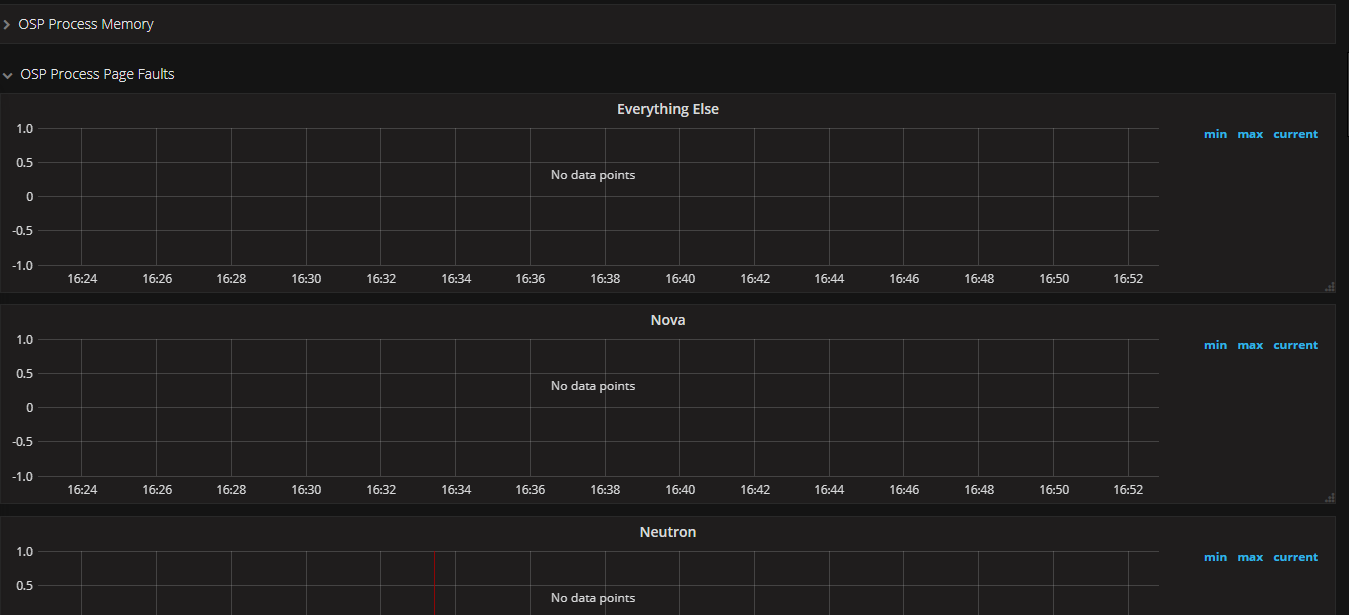
abv is screenshot of before adding metrics as it shows no data points

abv is screenshots adding first to 2 metrics for openstack dnsmasq…
so my question is manually i need to set all metrics like one by one to get details fo openstack and some times ill get internal error for few metrics if I set, so pls suggest me sir…thyank you in advance
I still don’t understand. You need to explain it step by step. What do you mean by “manually i need to set all metrics like one by one”? Are you forgetting to save your dashboard so that there are no queries on the metric tab?