I have a dashboard with multiple panels the query InfluxDB.
Grafana and InfluxDB are both running on the same server in Docker containers.
If I Edit one panel and refresh, the query runs just fine.
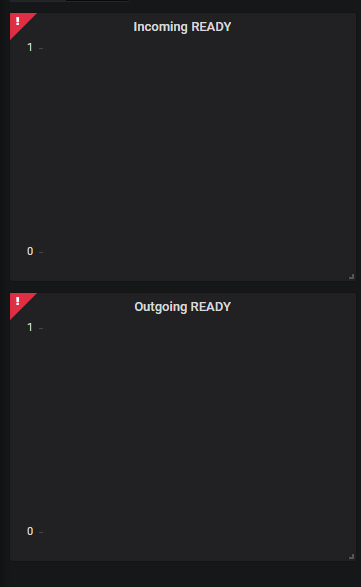
If I look at the full dashboard and refresh, the two queries get a Network Error.
I looked at this with Chrome debug but am not sure where to go next.