Hi, I am a simple user an use Grafana 7.5.0 and am looking for a plugin.
grant2
October 24, 2022, 9:35am
2
Welcome @simpleuser
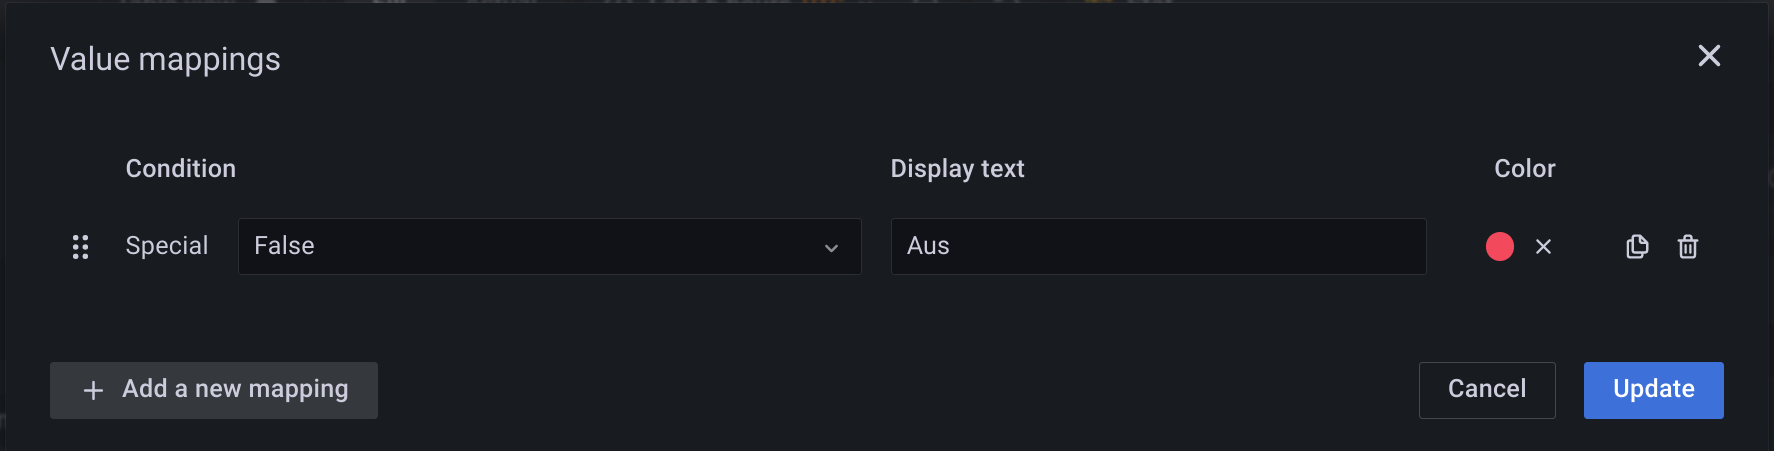
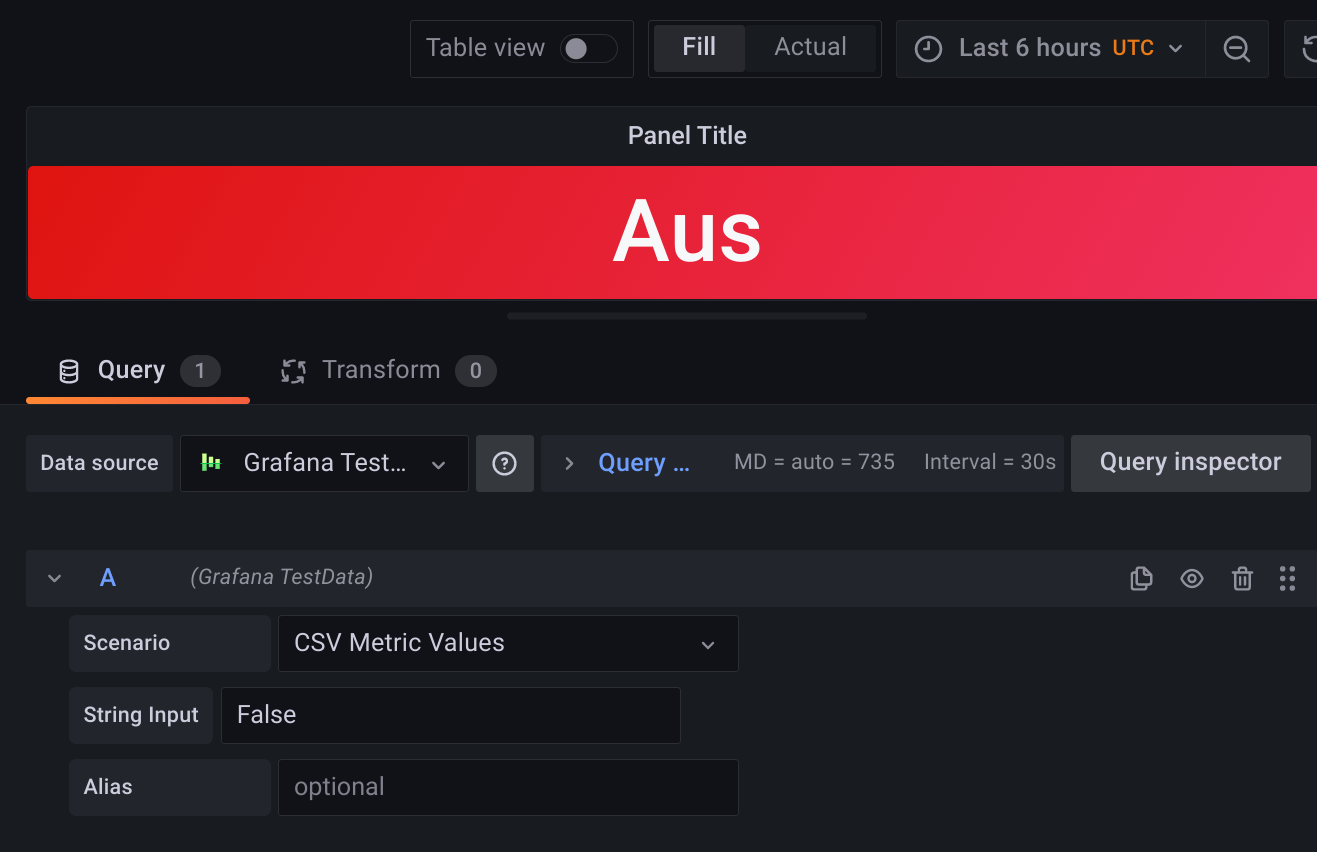
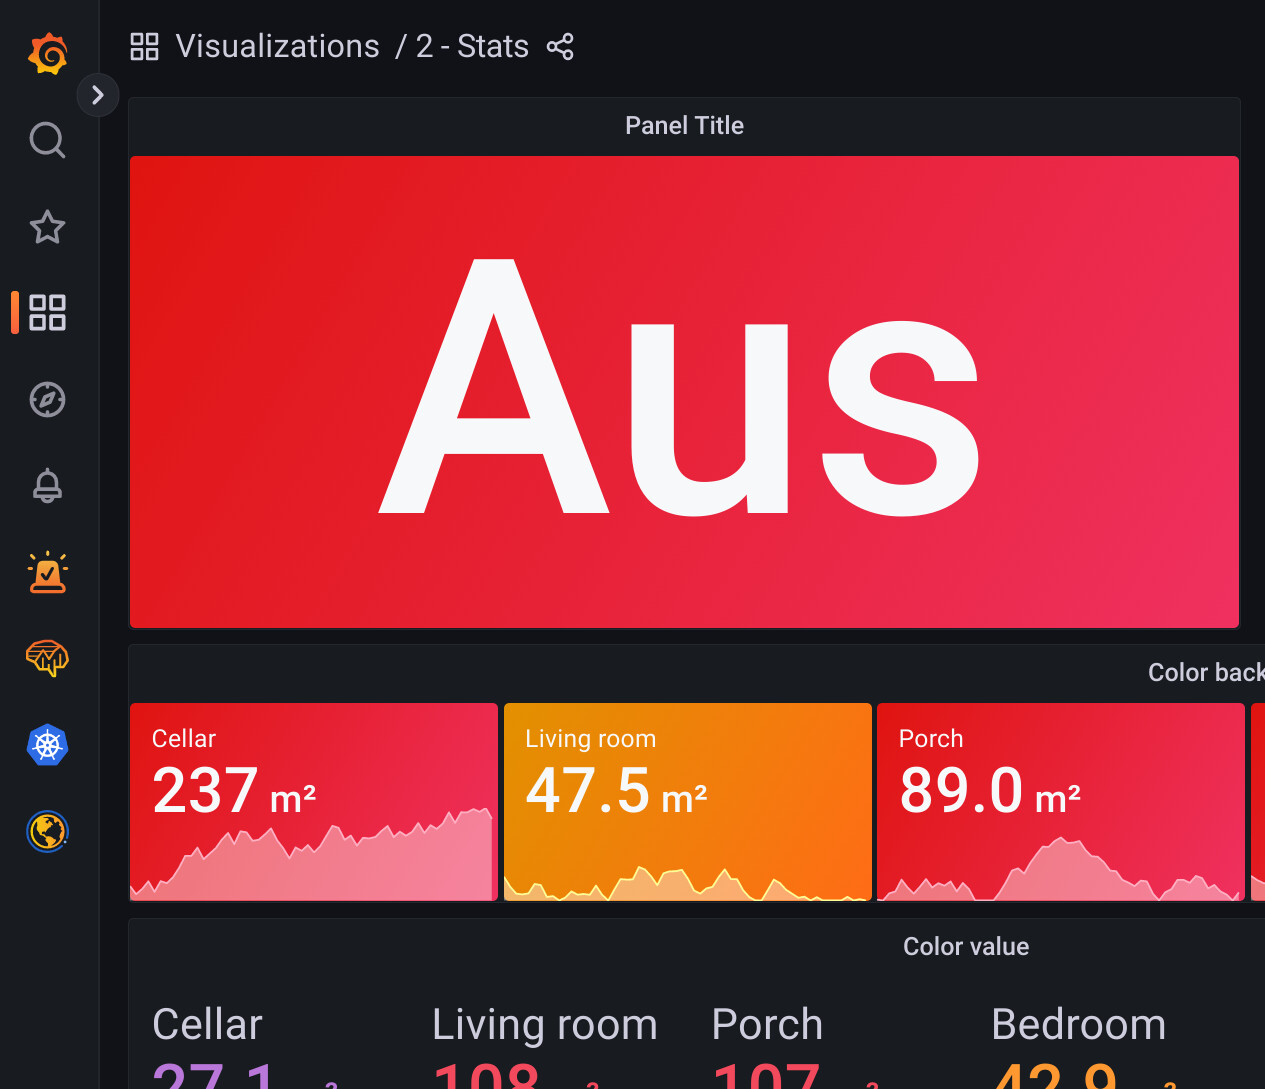
Have you tried using the Value Mapping? For example, to change the False boolean to the word “Aus”, you would do this:
and (as long as you are OK with a rectangle), you can change the size and color.
Hi grant2.
I assume the visualization is discrete. I played around a lot here. Only what I can display is a changing bar that appears once short and once long.
Maybe I have an error in some timeline
grant2
October 24, 2022, 10:40pm
6
I would recommend you upgrade to the latest version of Grafana, or at least experiment on play.grafana.org , and see what you can come up with.
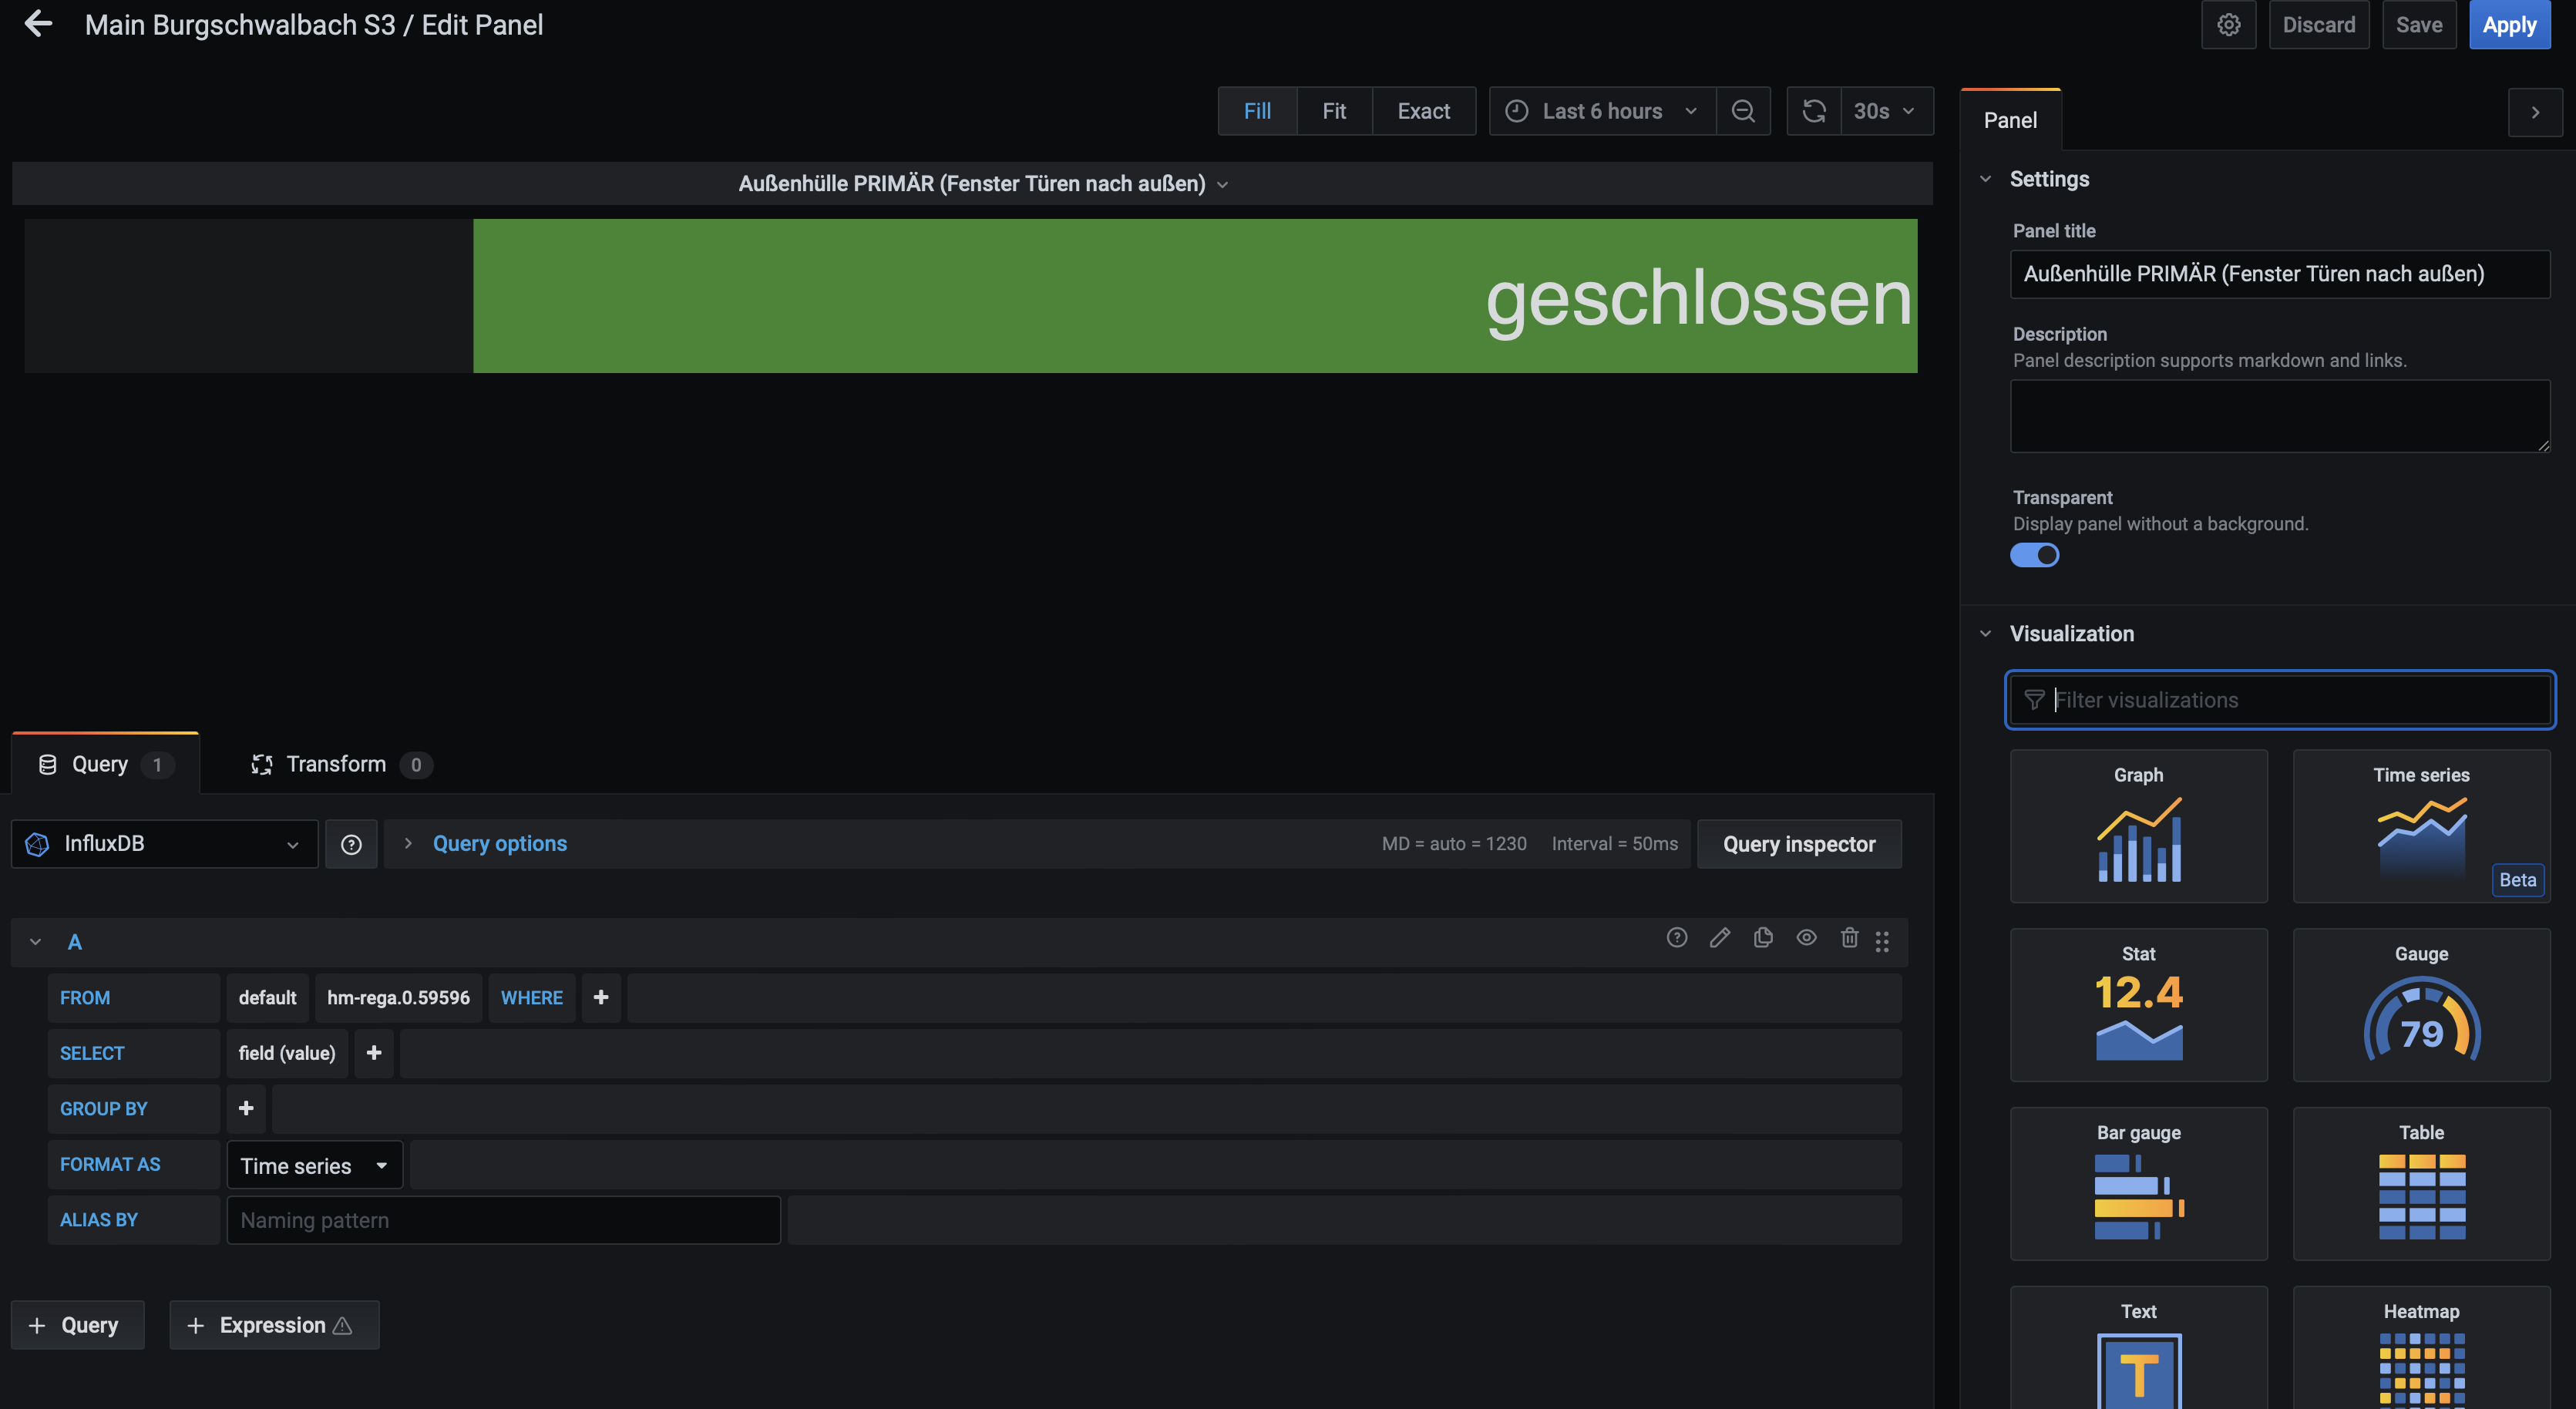
using svg is one way
Might be done better with apache echarts grafana plugin
@mikhailvolkov
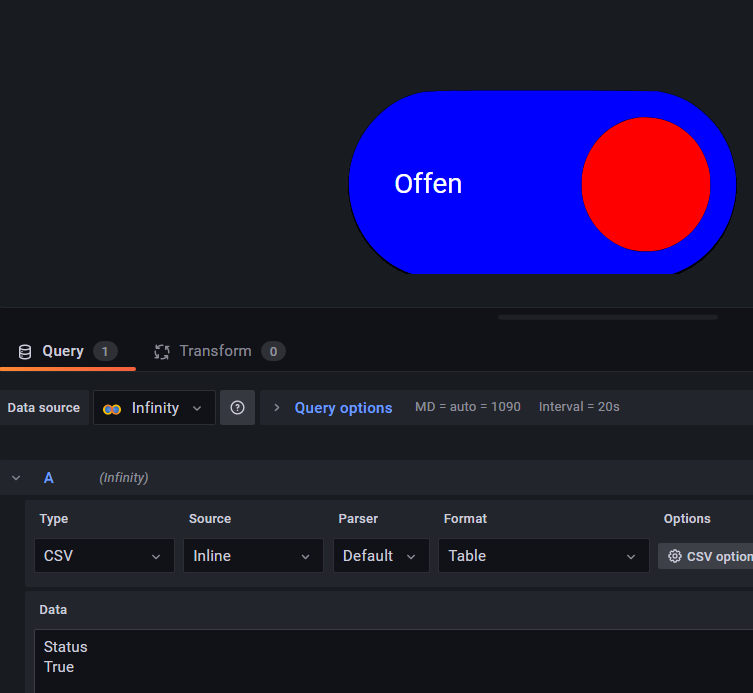
this uses the following simple js code (pretty sure this could be done even more succinct)
var s = Snap(svgnode);
const rows = ctrl.data[0].rows[0];


buildOnOff(rows.Status);

function buildOnOff(status) {

    let imgUrl = status === 'True' ?
"/public/img/on.svg" : "/public/img/off.svg"

    const i = s.image(imgUrl, 305, -92, 360, 375);

    let text = status === 'True' ? s.text(50, 200, "Offen") :
 s.text(460, 200, "Geschlossen")

    text.attr({
          'font-size':25,
          'fill': "#FFFFFF"
      });

}
Wow, many thx both of u. I try it in the evening and will report.
play.grafana.org is very very cool. thx 4 this information. And at last I will update Grafana.
yosiasz
October 25, 2022, 9:08pm
12
or you can use apache echarts grafana plugin
const onOffStatus = data.series[0].fields[0].values.buffer[0]

let dasImage = onOffStatus === 'True' ?
  'data:image/svg+xml;base64,YOUR_BASE64_SVG_TOKEN_FOR_OPEN' :
  'data:image/svg+xml;base64,YOUR_BASE64_SVG_TOKEN_FOR_CLOSED'
return {
  xAxis: { show: false },
  yAxis: { show: false },
  series: [
    {
      type: 'image',
      startAngle: 200,
      endAngle: -20,
      center: ['50%', '70%'],
      axisLine: {
        lineStyle: {
          width: 8,
          color: [
            [0.3, 'red'],
            [0.7, 'orange'],
            [1, '#96BE0F']
          ]
        }
      },
      pointer: {
        itemStyle: {
          color: 'auto'
        }
      },
      axisTick: {
        distance: -15,
        length: 5,
        lineStyle: {
          color: '#fff',
          width: 1
        }
      },
      splitLine: {
        distance: -15,
        length: 8,
        lineStyle: {
          color: '#fff',
          width: 2
        }
      },
      axisLabel: {
        color: 'auto',
        distance: -20,
        fontSize: 12
      },
      detail: {
        valueAnimation: true,
        formatter: '{value} %',
        color: 'auto'
      },
      data: [50]
    }
  ],
  graphic: {
    type: 'image',
    left: 'center',
    bottom: 350,
    offsetCenter: [0, '-60%'],
    style: {
      image: dasImage,
      width: 480
    }
  }
};