-
What Grafana version and what operating system are you using?
Grafana v9.1.3 / Microsoft SQL
-
What are you trying to achieve?
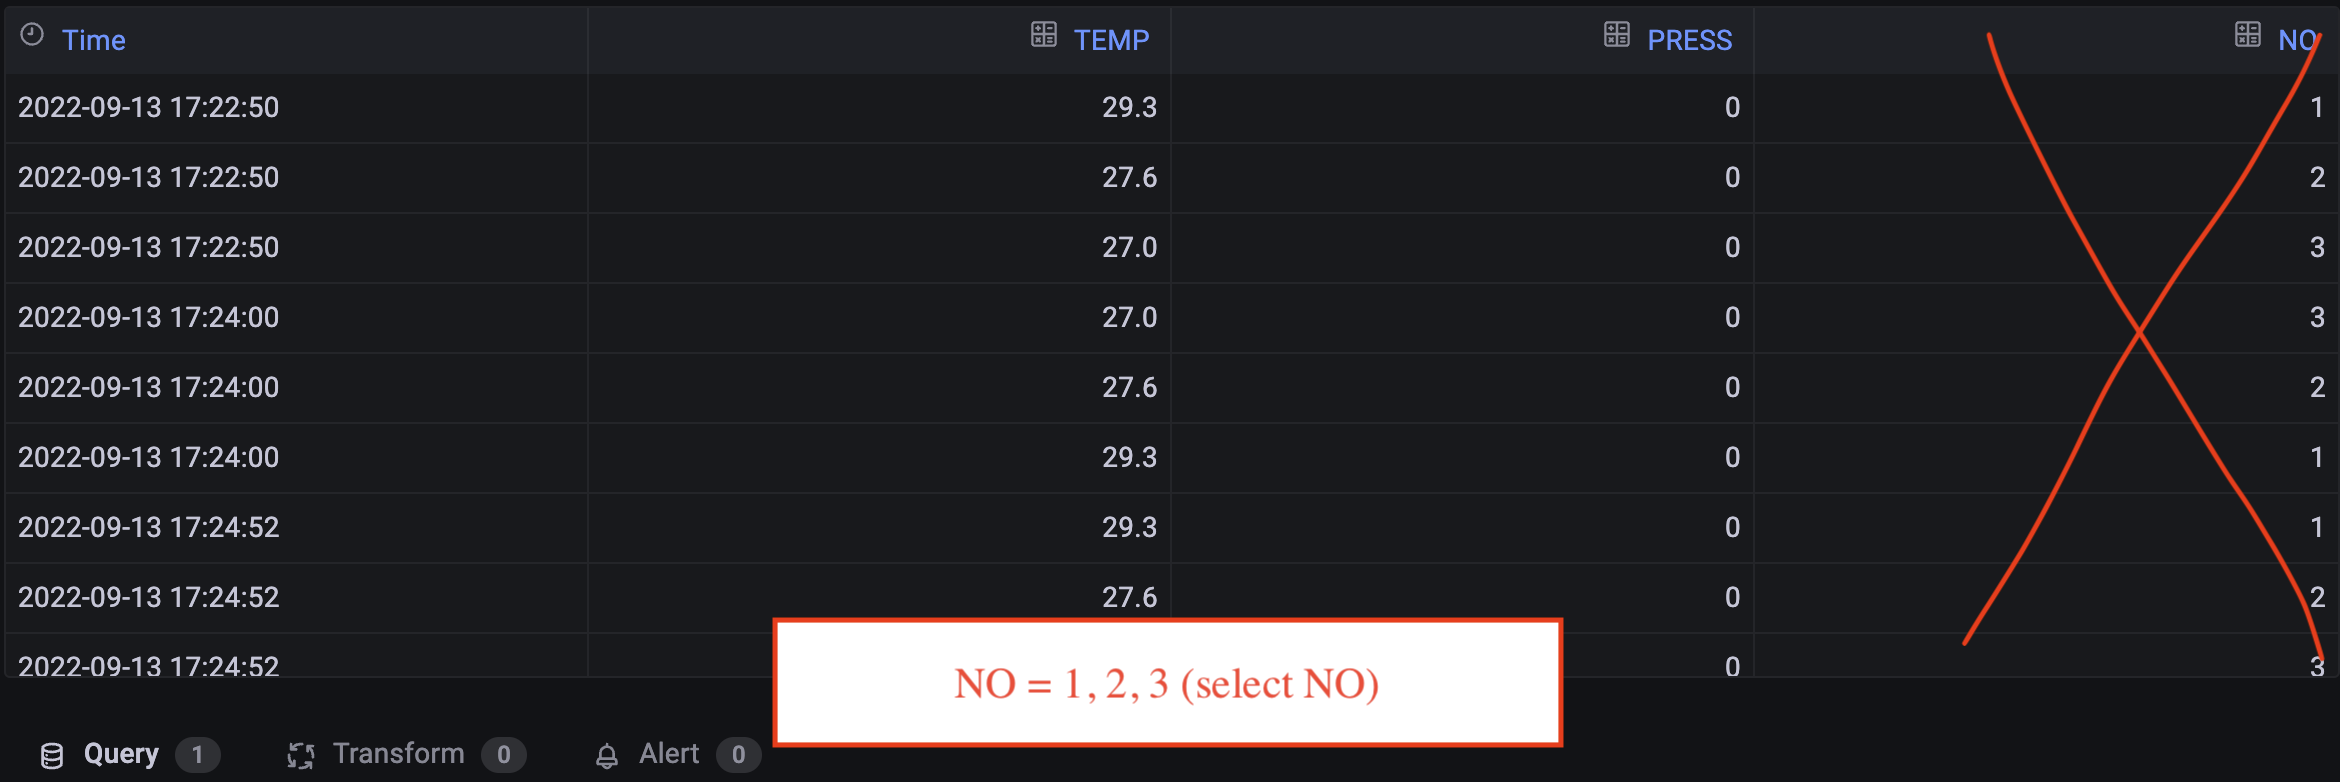
There are data of TIME, TEMP, PRESS, and NO in one table.
The NO column is the ID of the sensor.
I want to draw a time series graph of TEMP and PRESS by sensor ID.

- How are you trying to achieve it?
I think we should make several tables for each sensor ID ‘NO’. But I don’t know what to do.
- What did you expect to happen?
There are several tables as shown below, and several graphs want to be drawn by NO.

- Can you copy/paste the configuration(s) that you are having problems with?
The picture below is my query sentence.
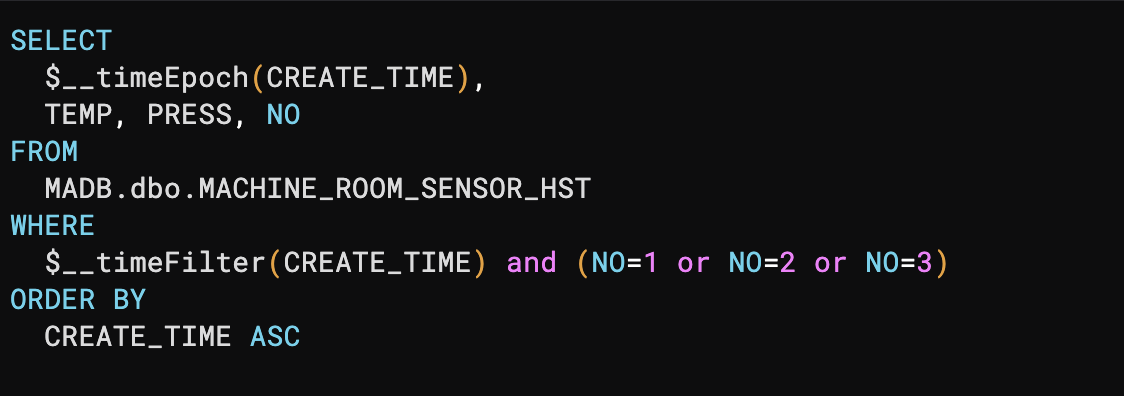
I really want someone to help me.