I am considering grafana as a way to display and analyse scientific experimental data in my company. At the moment, influxdb would be the database. I would like my colleagues to be able to construct panels and simply select a bucket (or “experiment”), measurement (or “iteration of this experiment”) and field (or “data channel within the iteration”) in the database without worrying about the flux syntax. Kind of like what existed for influxQL but even simpler.
I think building a custom datasource plugin which abstracts all the querying logic would be the way to go. To build upon what already exists, I would like to “extend” the builtin influxdb datasource plugin. Some reasearch in other discussions leads me to believe this is not so straight forward…
Has anyone done this recently in grafana 7.x? Any suggestions on the best way forward are welcome
There’s a one example which has caught my eye: https://getcurve.io/ is built on Grafana components, but it does not really do what we want. It removes too much of Grafana’s basic functionality and the data organization is too flat (there is no “experiment” level). It provides a user-friendly interface to load data in the db but everything seems to be loaded in the same bucket.
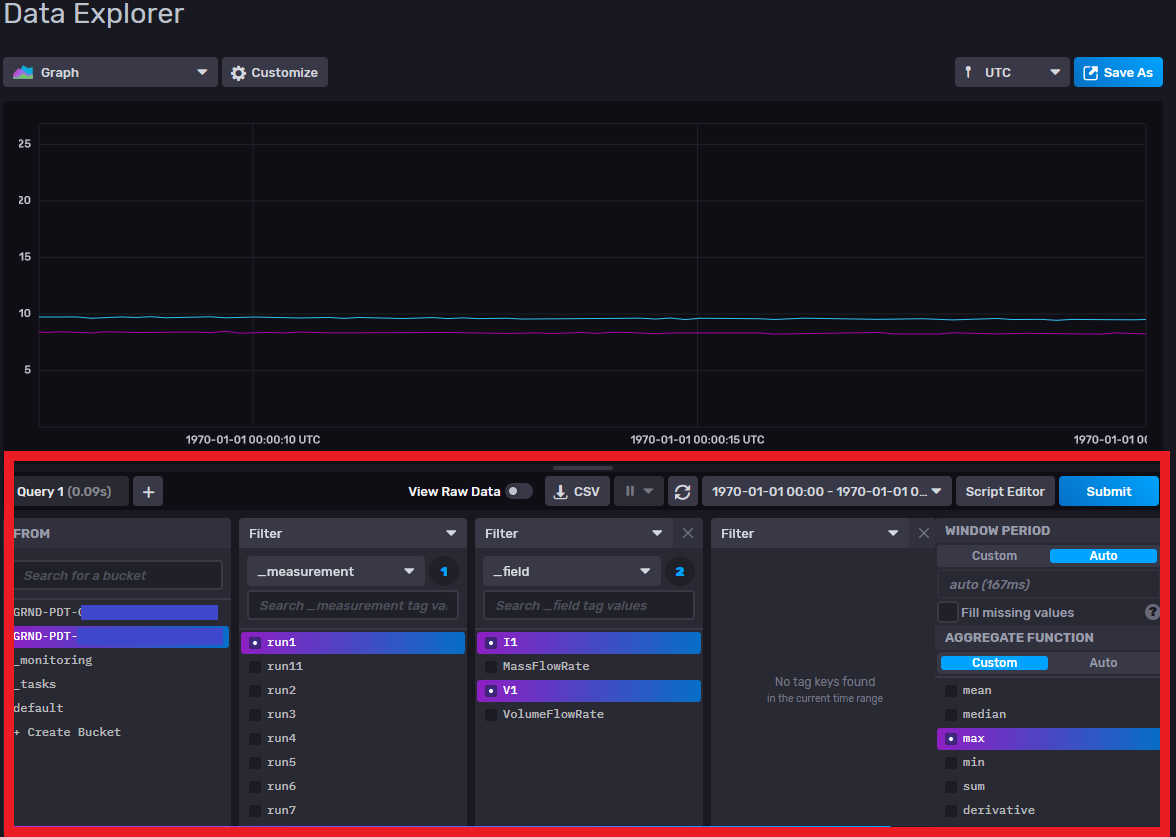
Also, as an example of a solution which would perfectly fit our needs, see the influxdb 2.0 data explorer query builder.
Hi @ericbrunner, yes, I agree that using Data Explorer could be a great way to go here. And if you click on the Script Editor button (middle-right of the UI), you’ll see the automatically-generated Flux code that you can drop into a Grafana dashboard.
Hi @alsargent. Indeed, it would be nice to have that functionality directly implemented in the grafana influxdb plugin.
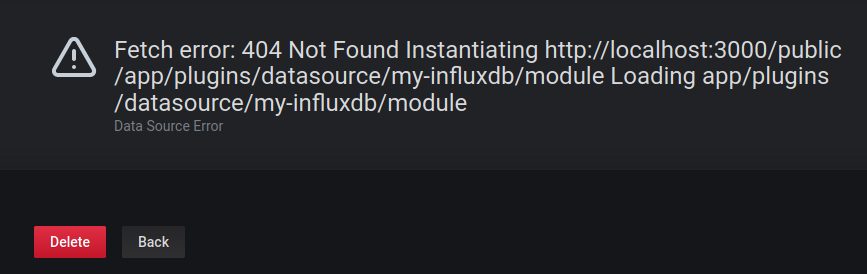
I went ahead and copied the plugin directory in grafana/public/app/plugin/datasource/influxdb to grafana/public/app/plugin/datasource/my-influxdb and modified the package .json, hoping it would let me develop upon the duplicate plugin. I then built grafana with yarn dev. Grafana does not show any error in the logs at start-up, but I get the following error when trying to open the plugin config page.