My setup:
Grafana : v7.1.5
Data source : MySQL (Connection to SingleStore database with user ‘dbuser’)
I have a query such that the available query execution memory for ‘dbuser’ is insufficient to run the query and when I run that query using SingleStore CLI I get this error: ERROR 1712 (HY000): Query execution memory use (673.498268 MB) has reached the maximum memory for its resource pool roleuibasic (5%).
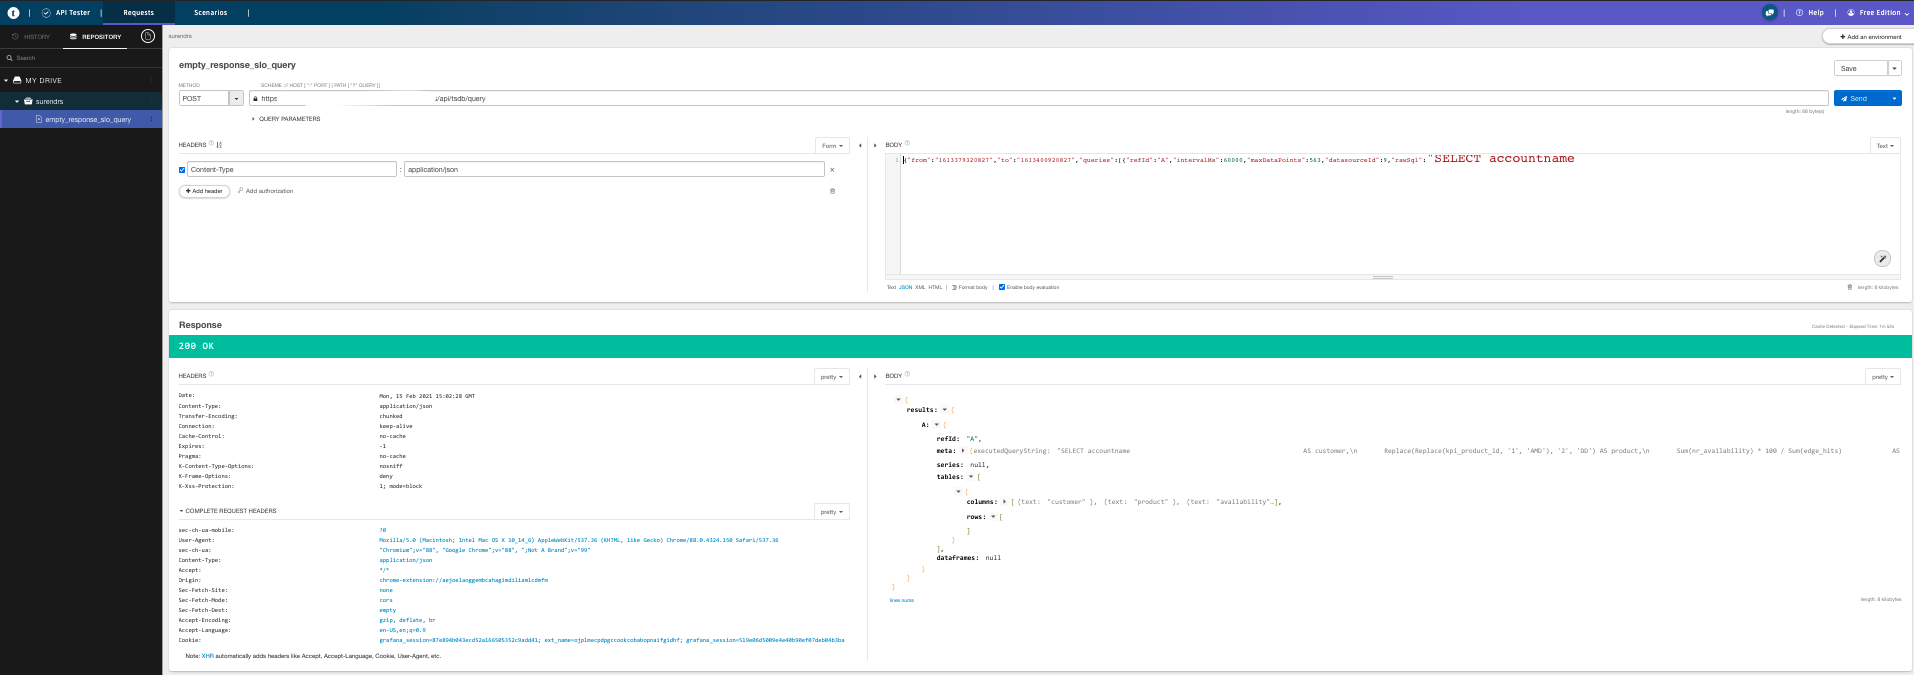
But, when I run the same query using HTTP API I get 200 OK responses with all the column header names with no data. This is misleading as the response is as same as the situation when there is no data available for the given query.