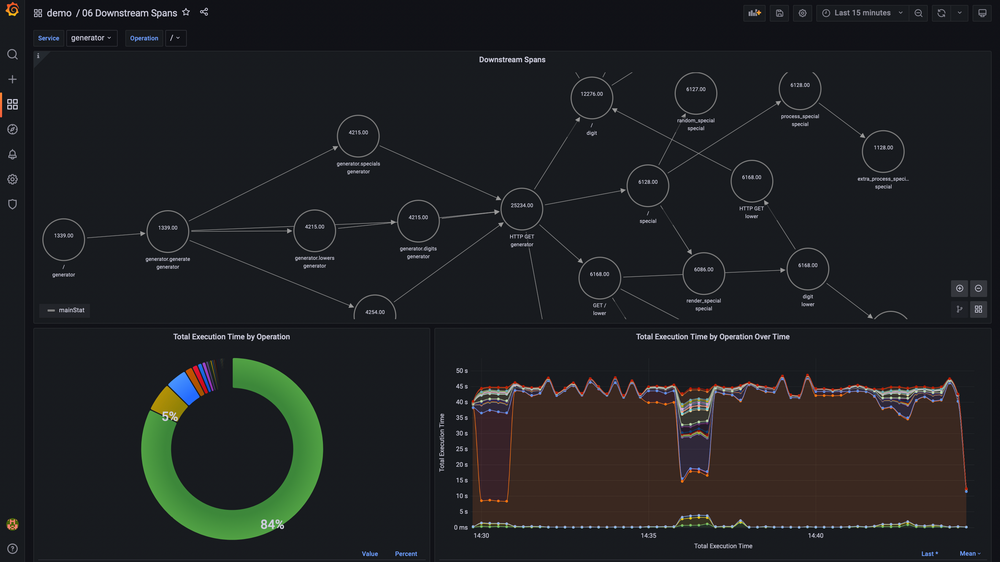
I want to build a dashboard similar to this one : https://www.timescale.com/blog/content/images/size/w1000/2022/02/downstream-spans-dashboard.png
(full article: Learn OpenTelemetry Tracing With This Lightweight Microservices Demo )
The problem is that I am only interested in self time , t1+t3+t6 like in this picture

Is this possible with the current metrics generator ? If not wouldn’t it be useful also generate self time ?
Hi @ovidiubuligan. Unfortunately no, but it’s close. The metrics-generator it’s not trace-aware, as it works at the span level, and all the metrics it generates are span-based.
The metrics-generator will record count and latency of all ingested spans, and will attach labels such as service_name (that’s configurable). For example, you could do a latency histogram showing percentiles by executing this query
histogram_quantile(0.99, sum(rate(traces_spanmetrics_latency_bucket{service="my-app"}[5m])) by (le, span_name))
but the results won’t be grouped per traceID, nor the self-time calculated.
Making the metrics-generator work at the trace level would require a decent amount of work, but I still it’s interesting. Please leave an issue if you want.
As alternative, I think this is something that could be possible with TraceQL in the distant future, but not soon I’m afraid :(.
Do you know any ETA on TraceQL? . Will it support unions ?
Do you have a link where traceql is discussed ?
Sure,
TraceQL Concepts Design Doc
Parser PR
Storage Implementation PR
This is actively being developed. Expect more firm news at observability con this year (2022).