Loss data Loki simple scalable deployment mode

Hi, I’m new to Loki, It is pretty good and solves many of my problems. But sometimes I face issues that logs seem to be like loss in some period. I config to store data chunks in s3, and also have WAL configured.

Here is the dashboard collected from Loki logs.

Does anyone have any clue or has faced this problem, please let me know.
Thank you!

Update: After a day, I queried, and then the data comeback, still confused.

I’ve seen a few threads on the forum with similar issue. If you are using multiple writer instances, your problem is most likely in the ring membership. Please share your configuration and an output of the /ring output.

Here is my loki config map:

auth_enabled: false
common:
  compactor_address: 'loki-backend'
  path_prefix: /var/loki
  replication_factor: 3
  storage:
    s3:
      access_key_id:
      bucketnames: 
      insecure: false
      region:
      s3: 
      s3forcepathstyle: false
      secret_access_key:
frontend:
  scheduler_address: query-scheduler-discovery.logging-02.svc.cluster.local.:9095
  max_outstanding_per_tenant: 2048
frontend_worker:
  scheduler_address: query-scheduler-discovery.logging-02.svc.cluster.local.:9095
index_gateway:
  mode: ring
limits_config:
  enforce_metric_name: false
  max_cache_freshness_per_query: 10m
  reject_old_samples: true
  reject_old_samples_max_age: 168h
  split_queries_by_interval: 3h
  max_query_series: 100000
  max_entries_limit_per_query: 100000
memberlist:
  join_members:
  - loki-memberlist
ingester:
  chunk_block_size: 262144
  chunk_idle_period: 3m
  chunk_retain_period: 1m
  lifecycler:
    ring:
      replication_factor: 3
  max_transfer_retries: 0
  wal:
    enabled: true
    dir: /var/loki/wal
query_range:
  align_queries_with_step: true
  parallelise_shardable_queries: false
ruler:
  storage:
    s3:
      access_key_id:
      bucketnames:
      insecure: false
      region: 
      s3: 
      s3forcepathstyle: false
      secret_access_key:
    type: s3
runtime_config:
  file: /etc/loki/runtime-config/runtime-config.yaml
schema_config:
  configs:
  - from: "2022-01-11"
    index:
      period: 24h
      prefix: loki_index_
    object_store: s3
    schema: v12
    store: boltdb-shipper
server:
  grpc_listen_port: 9095
  http_listen_port: 3100
storage_config:
  hedging:
    at: 250ms
    max_per_second: 20
    up_to: 3


An Hour ago, I made the same query and it seemed like I got all logs, but after 30 minutes, I lost some data

Could you share or direct me to the right configuration? Thank you!

When I use a smaller time frame, the result changes in each query. And only data of the current day is lost.

I don’t see anything obviously wrong. Try setting query_ingesters_within to a smaller value, such as:

querier:
  query_ingesters_within: 2h

Thank you, let me try.

The problem seems to be fixed when I apply your suggestion

querier:
  query_ingesters_within: 2h

I will observe it.

Could I ask another question, I also use Loki stack with a single pod and see it consumes about a maximum of 1GB and 100 millicores, but its query speed is not different from Loki’s simple scalable deployment mode with Loki read, write, and backend separately that use about 2-3GB and 800 millicores. Do you have any best practices for enhancing query speed for this deployment mode?

Thank you so much!

If you are running in simple scalable mode, make sure query frontend is enabled, and you are splitting queries in a reasonable time frame. Unless you have really heavy log volume, I find that splitting queries by 30-minute is usually reasonable.

Also keep in mind a lot of performance gain for Loki comes from distribution, as a result if you don’t have adequate amount of logs you likely won’t get much performance gain out of running in simple scalable mode. Personally our Loki cluster with 4 readers can achieve roughly 5GB per second read performance, I know there are others with bigger cluster with a lot higher number.

1 Like

Thank you for your information!

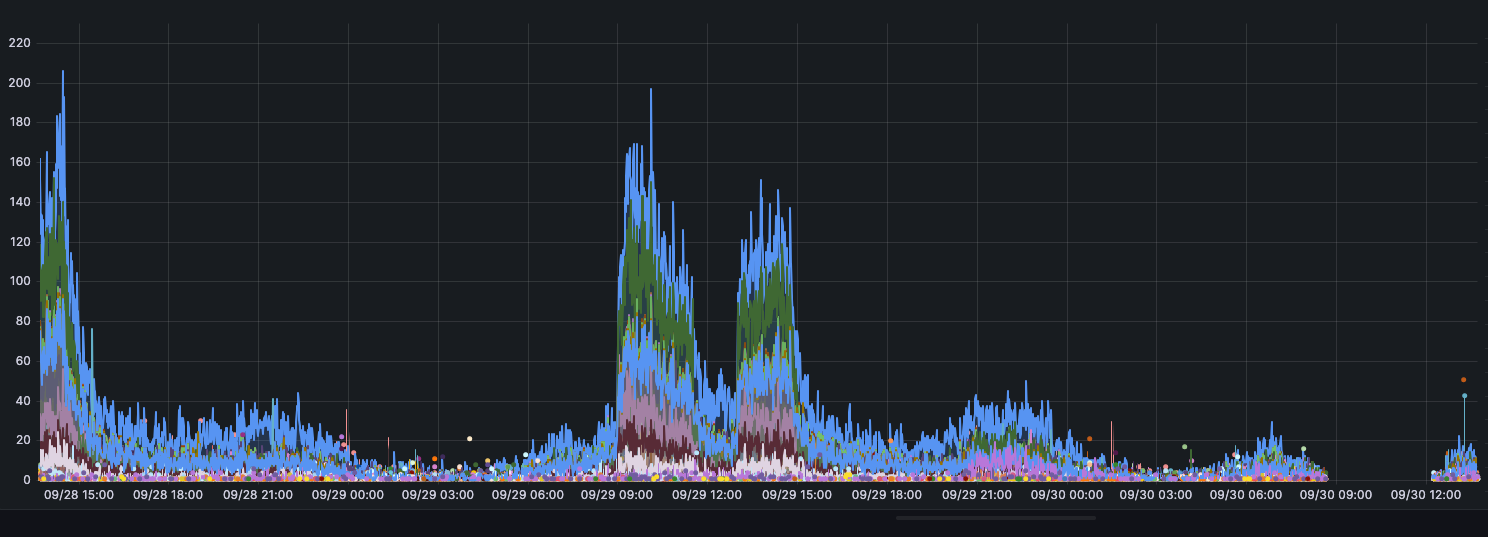
Today this error came back, I queried all containers, and they were lost data from 7h30 to 10h30 :disappointed: . From 9 am to 15pm, my app traffic was high, and the rest was low, in the high traffic time loki write resource was consumed a lot, and I see that the data mostly lost at this time of the current day, and the next day it was appeared. Is there any relative of the write component with the queries?

I think in the high traffic time, exceeded the burst of default loki.

You can add this in:

limit_configs:
    ingestion_burst_size_mb: 100
    ingestion_rate_mb: 80
    ingestion_rate_strategy: global

If your log is more than 80mb, you can increase the ingestion rate and the ingestion burst

1 Like

I’ve just applied the ingestion config, and the log came back :100:, I will watch it in the few next days and come back confirm.
Thank you!!!

I haven’t seen the issue come back anymore :blush:, Thank you @tonyswumac @fadjar340 so much!

But sometimes in high traffic time, the metrics are too slow (never timeout, hang forever) to be got even if I set the time range as 5 minutes ago (the first code block), but I query the log alone, it’s fine (the second code block).

sum by (url) (count_over_time(
{pod=~"ingress-nginx-controller-.*"}
|= "*-9321"
| pattern "<remote_addr> - <remote_user> <time_local> \"<method> <urlRaw> <protocol>\" <status> <body_bytes_sent> <_> \"<http_user_agent>\" <request_length> <request_time> [<proxy_upstream_name>] [<proxy_alternative_upstream_name>] <upstream_addr> <upstream_response_length> <upstream_response_time> <upstream_status> <req_id>"
| proxy_upstream_name="*-9321"
| remote_addr=~"$remote_addr"
| line_format "{{.urlRaw}}"
| pattern "<url>?<_>"
[60s])) > 60
{pod=~"ingress-nginx-controller-.*"}
|= "*-9321"
| pattern "<remote_addr> - <remote_user> <time_local> \"<method> <urlRaw> <protocol>\" <status> <body_bytes_sent> <_> \"<http_user_agent>\" <request_length> <request_time> [<proxy_upstream_name>] [<proxy_alternative_upstream_name>] <upstream_addr> <upstream_response_length> <upstream_response_time> <upstream_status> <req_id>"
| proxy_upstream_name="*-9321"
| remote_addr=~"$remote_addr"
| line_format "{{.urlRaw}}"
| pattern "<url>?<_>"

Do you have any idea?

This topic was automatically closed 365 days after the last reply. New replies are no longer allowed.