AWS EKS 1.33
public.ecr.aws/karpenter: 1.6.1 values:
        values = <<-EOT
      serviceMonitor:
        enabled: true
      nodeSelector:
        karpenter.sh/controller: "true"
      serviceAccount:
        name: ${module.karpenter.service_account}
      settings:
        clusterName: ${module.eks.cluster_name}
        clusterEndpoint: ${module.eks.cluster_endpoint}
        interruptionQueue: ${module.karpenter.queue_name}
        featureGates:
          spotToSpotConsolidation: true
      tolerations:
        - key: CriticalAddonsOnly
          operator: Exists
        - key: karpenter.sh/controller
          operator: Exists
          effect: NoSchedule
      podAnnotations:
        k8s.grafana.com/scrape: "true"
        k8s.grafana.com/metrics.path: "/metrics"
      webhook:
        enabled: false
    EOT
k8s-monitoring: 3.2.2 values:
        values = <<EOF
# Common tolerations & nodeSelector
_tolerations: &tolerations
  tolerations:
    - key: "karpenter.sh/controller"
      operator: "Equal"
      value: "true"
      effect: "NoSchedule"
  nodeSelector:
    karpenter.sh/controller: "true"

cluster:
  name: eks-${local.environment}
destinations:
  - name: grafana-cloud-metrics
    type: prometheus
    url: ${local.agent_prometheus_grafana_cloud_url}
    auth:
      type: basic
      username: "${local.agent_prometheus_grafana_cloud_username}"
      password: ${local.agent_grafana_cloud_token}
  - name: grafana-cloud-logs
    type: loki
    url: ${local.agent_loki_grafana_cloud_url}
    auth:
      type: basic
      username: "${local.agent_loki_grafana_cloud_username}"
      password: ${local.agent_grafana_cloud_token}
  - name: grafana-cloud-otlp-endpoint
    type: otlp
    url: https://xxxxxxx./otlp
    protocol: http
    auth:
      type: basic
      username: "xxxxx"
      password: ${local.agent_grafana_cloud_token}
    metrics:
      enabled: true
    logs:
      enabled: true
    traces:
      enabled: true
clusterMetrics:
  enabled: true
  <<: *tolerations
  kepler:
    enabled: true
    <<: *tolerations
  kube-state-metrics:
    enabled: true
    <<: *tolerations
  node-exporter:
    enabled: true
    <<: *tolerations

annotationAutodiscovery:
  enabled: true
  <<: *tolerations
  controller:
    <<: *tolerations

prometheusOperatorObjects:
  enabled: true
  <<: *tolerations
  controller:
    <<: *tolerations

clusterEvents:
  enabled: true
  <<: *tolerations
  controller:
    <<: *tolerations

podLogs:
  enabled: true
  <<: *tolerations
  controller:
    <<: *tolerations

applicationObservability:
  enabled: true
  <<: *tolerations
  receivers:
    otlp:
      grpc:
        enabled: true
        port: 4317
      http:
        enabled: true
        port: 4318
    zipkin:
      enabled: true
      port: 9411
  connectors:
    grafanaCloudMetrics:
      enabled: true
integrations:
  alloy:
    instances:
      - name: alloy
        labelSelectors:
          app.kubernetes.io/name:
            - alloy-metrics
            - alloy-singleton
            - alloy-logs
            - alloy-receiver
          karpenter.sh/controller:
            - true
alloy-metrics:
  enabled: true
  <<: *tolerations
  controller:
    <<: *tolerations
alloy-singleton:
  enabled: true
  <<: *tolerations
  controller:
    <<: *tolerations

alloy-logs:
  enabled: true
  <<: *tolerations
  controller:
    <<: *tolerations

alloy-operator:
  <<: *tolerations

alloy-receiver:
  enabled: true
  <<: *tolerations
  alloy:
    extraPorts:
      - name: otlp-grpc
        port: 4317
        targetPort: 4317
        protocol: TCP
      - name: otlp-http
        port: 4318
        targetPort: 4318
        protocol: TCP
      - name: zipkin
        port: 9411
        targetPort: 9411
        protocol: TCP
  controller:
    <<: *tolerations
EOF
k describe pod karpenter-autoscaler-6858d846d6-szq4r -n kube-system
Name:                 karpenter-autoscaler-6858d846d6-szq4r
Namespace:            kube-system
Priority:             2000000000
Priority Class Name:  system-cluster-critical
Service Account:      karpenter
Node:                 ip-10-63-2-27.eu-central-1.compute.internal/10.63.2.27
Start Time:           Tue, 05 Aug 2025 13:47:36 +0200
Labels:               app.kubernetes.io/instance=karpenter-autoscaler
                      app.kubernetes.io/name=karpenter
                      pod-template-hash=6858d846d6
Annotations:          k8s.grafana.com/metrics.path: /metrics
                      k8s.grafana.com/scrape: true
Status:               Running
SeccompProfile:       RuntimeDefault
IP:                   10.63.2.234
for test added annotations to service but no difference.
Only karpenter_cloud are available
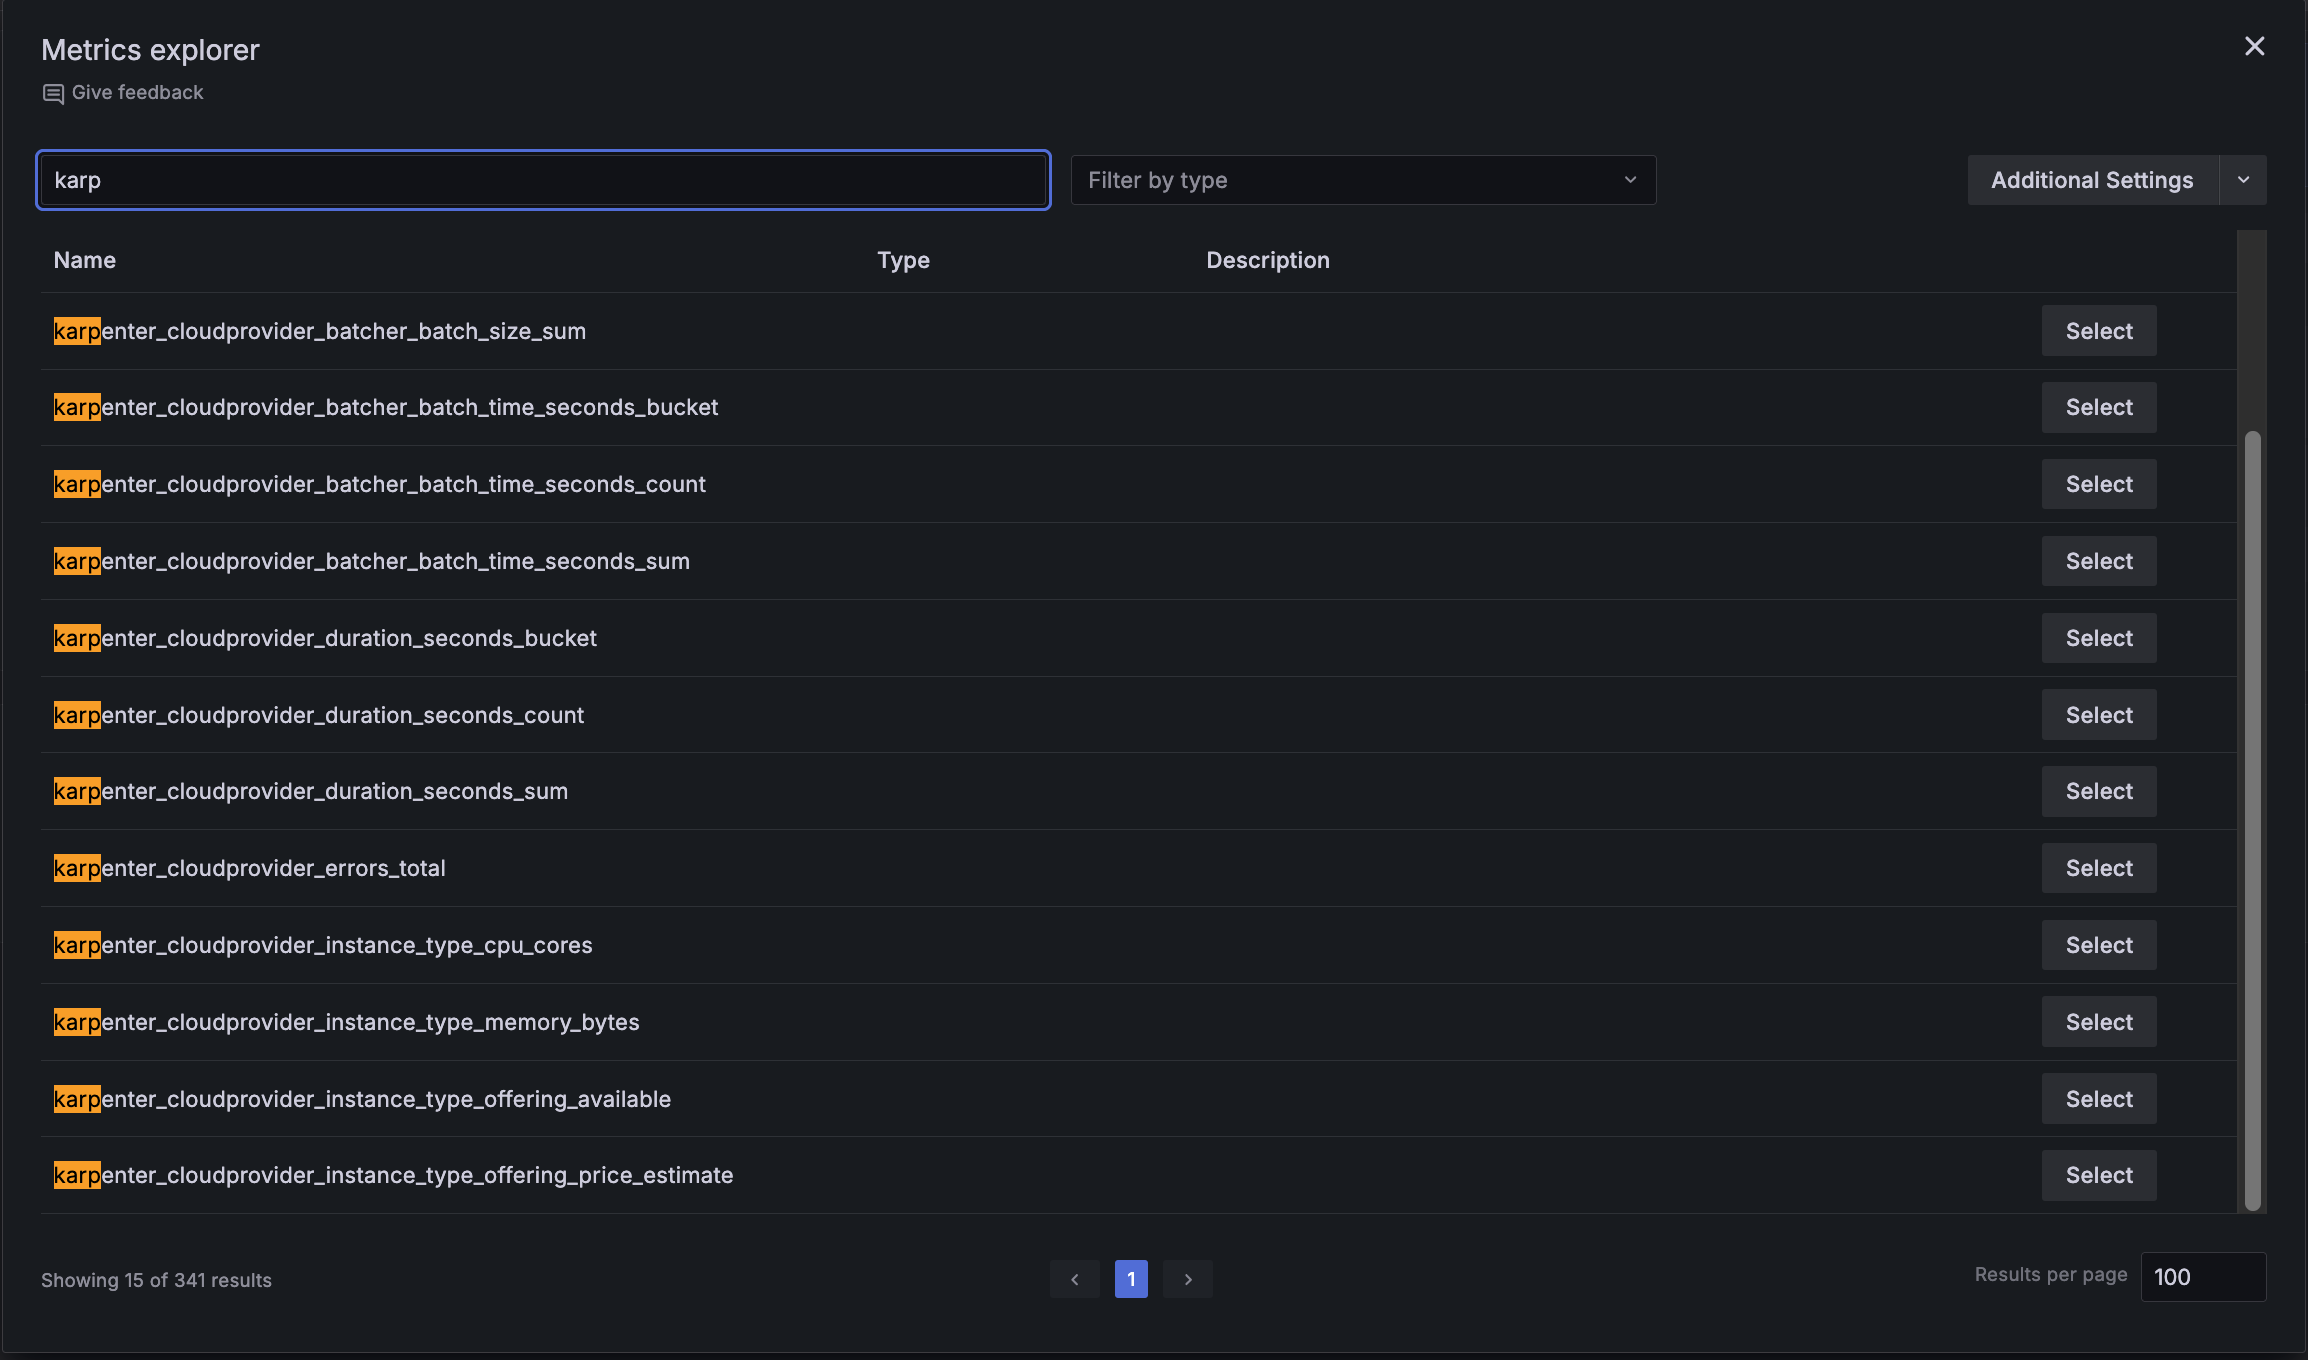
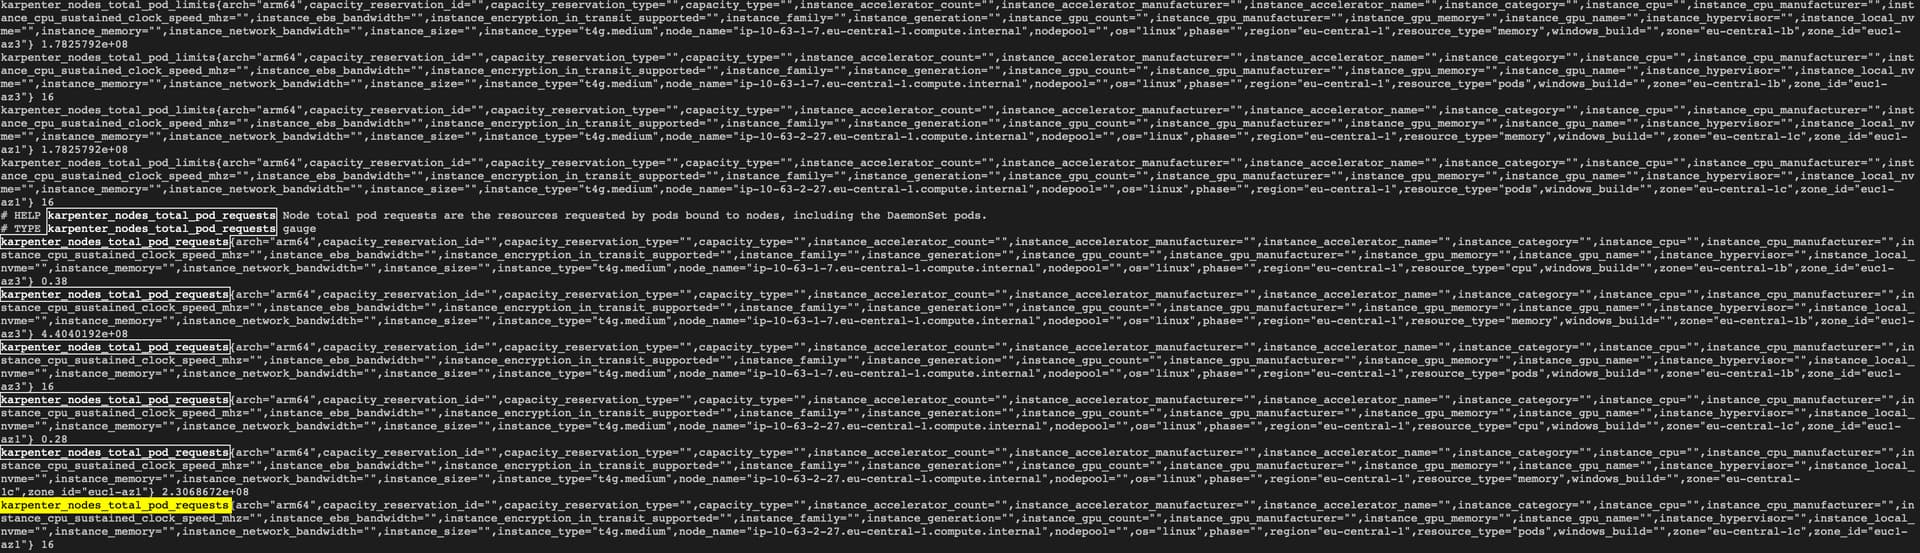
but metrics endpoint shows
karpenter_nodes_total_pod_requests
karpenter_nodes_total_pod_limits
are exist
Any thoughts ?