EDIT: Solved below.
Grafana 9.4.7 in Docker, accessed via Windows 10.
Trying to inner join and use new column as metric
Table: timesheet
Field: user (int)
Field: duration (int)
Field: start_time (datetime)
Table: users
Field: id (int)
Field: username (varchar(180))
Field: alias (varchar60))
Step by step:
From table timesheet, the start_time and duration fields result in a proper graph, however I want to split this out per user. But user is not rendered as metric.
SELECT
  user "metric",
  start_time AS "time",
  duration AS "value"
FROM timesheet

I guessed it is because the field is INT type. When converting it to CHAR, it does work:
SELECT
  CONVERT (user, char) AS "metric",
  start_time AS "time",
  duration AS "value"
FROM timesheet
ORDER BY
  start_time

This feels like a bad method, but anyways, the numbers should be the according names from the other table, so going for a join.
SELECT
  t.user AS "t.id",
  t.start_time AS "time",
  t.duration AS "value",
  u.id AS "u.id",
  u.username AS "metric"
FROM timesheet t
INNER JOIN users u ON u.id = t.user;
A table renders as expected, with all the columns.
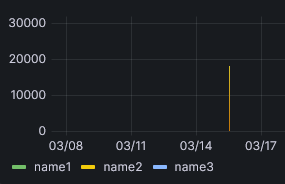
The graph looks like this:

Using transform to hide t.id and u.id does not result in a split out metric, as in, a value per username. Applying the convert trick to t.id and u.id this time does not result in a value per username as well.
The result I am looking for is this:
(Mock up via Fx dev tools.)
How to accomplish this?