Hello,
I’m currently using Prometheus with Grafana to capture server metrics and display on a nice Grafana Dashboard. However some dashboards you can import are built round Influxdb and Telegraf.
So I’ve installed Influx DB and then installed the Telegraf agent on a couple of VMs and the data is not being pulled into Grafana, all I see is the server names in the drop down list.
How can I check if the InfluxDB is receiving the data from the 2 servers?
Dashboard - https://grafana.com/grafana/dashboards/2381
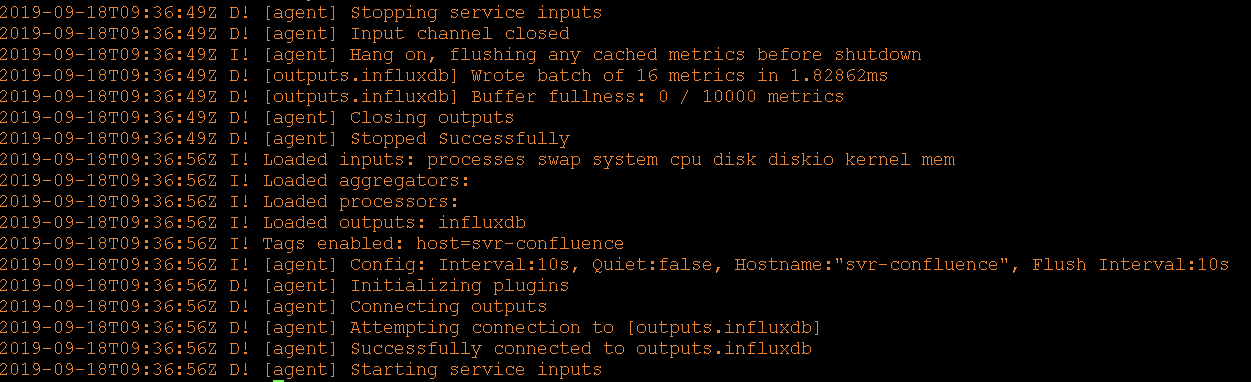
What is interesting this is the Telegraf log when I stop and start the service on my server called svr-confluence, I have edit the telegraf.conf file, but had to miss reporting the metrics for the network card, look what happens:
So it looks like it is working, until I edit the vi /etc/telegraf/telegraf.conf with this:
[[inputs.net]]
 interfaces = ["eth0"]

log file
2019-09-18T09:41:00Z D! [outputs.influxdb] Wrote batch of 17 metrics in 27.28973ms
2019-09-18T09:41:00Z D! [outputs.influxdb] Buffer fullness: 6 / 10000 metrics
2019-09-18T09:41:04Z D! [agent] Stopping service inputs
2019-09-18T09:41:04Z D! [agent] Input channel closed
2019-09-18T09:41:04Z I! [agent] Hang on, flushing any cached metrics before shutdown
2019-09-18T09:41:04Z D! [outputs.influxdb] Wrote batch of 6 metrics in 1.72249ms
2019-09-18T09:41:04Z D! [outputs.influxdb] Buffer fullness: 0 / 10000 metrics
2019-09-18T09:41:04Z D! [agent] Closing outputs
2019-09-18T09:41:04Z D! [agent] Stopped Successfully
What could be wrong?
Thanks