Hello everybody,
I am new in this area and I need some help. I am tryingto visualize the number of events in Grafana but I don’t manage it. The query is in Elasticsearch.

Thank you very much for every suggestion.
ET
Hello everybody,
I am new in this area and I need some help. I am tryingto visualize the number of events in Grafana but I don’t manage it. The query is in Elasticsearch.
Thank you very much for every suggestion.
ET
Hi,
Can you tell us which elasticsearch & grafana version you are running?
And maybe dump a screenshot of your datasource-settings for elasticsearch?
Do you see any data when you empty the Query field. (do you get results from elasticsearch?)
Can you tryout your query (in kibana for example) to check the lucene syntax.
Also make sure you time-range is big-enough in grafana.
Hi,
thank you very much for your reply. The Grafana Version is 7.0. How can I see which version of elastic search we run?
I tried out the query in kibana and it was successful.
Where should I figure out the time-range in Grafana? The relative time is 7 days.
Thank you and best regards
Eva
You should be able to browse directly to your elasticsearch instance, and you will get some debugging output (ex. http://localhost:9200/ )
Can you validate if the datasource is configured correctly? (when opening the datasource page, pressing the “Save & Test” button should give feedback like: “Index OK. Time field name OK.”
Try to write to Elastic with UTC timestamp
Hello,
thanks a lot for the help!
Hier is my Elastic Search details
{
“name” : “evanthia-N8xxEZ”,
“cluster_name” : “elasticsearch”,
“cluster_uuid” : “sZWKkKBMTK-C8eqhQSMOJA”,
“version” : {
“number” : “7.7.0”,
“build_flavor” : “default”,
“build_type” : “deb”,
“build_hash” : “81a1e9eda8e6183f5237786246f6dced26a10eaf”,
“build_date” : “2020-05-12T02:01:37.602180Z”,
“build_snapshot” : false,
“lucene_version” : “8.5.1”,
“minimum_wire_compatibility_version” : “6.8.0”,
“minimum_index_compatibility_version” : “6.0.0-beta1”
},
“tagline” : “You Know, for Search”
So latest elastic search & grafana,
Where does the $reco_mandant_name variable come from and are you using it in combo with some repeats or as a static variable?
The time can be shifted if the elastic search and grafana servers are configured for different timezones. This can result in your events appearing to be happening in the future.
Maybe try to debug your query by running only part of it.
Do you get any results if you only use the source: "/var/log..." part of your query?
You’re also using the event_time field to do the date histogram grouping. Do you know what the raw-data in this field looks like, or how it is mapped in elasticsearch? If this is mapped to something other than a date it might screw up the histogram logic.
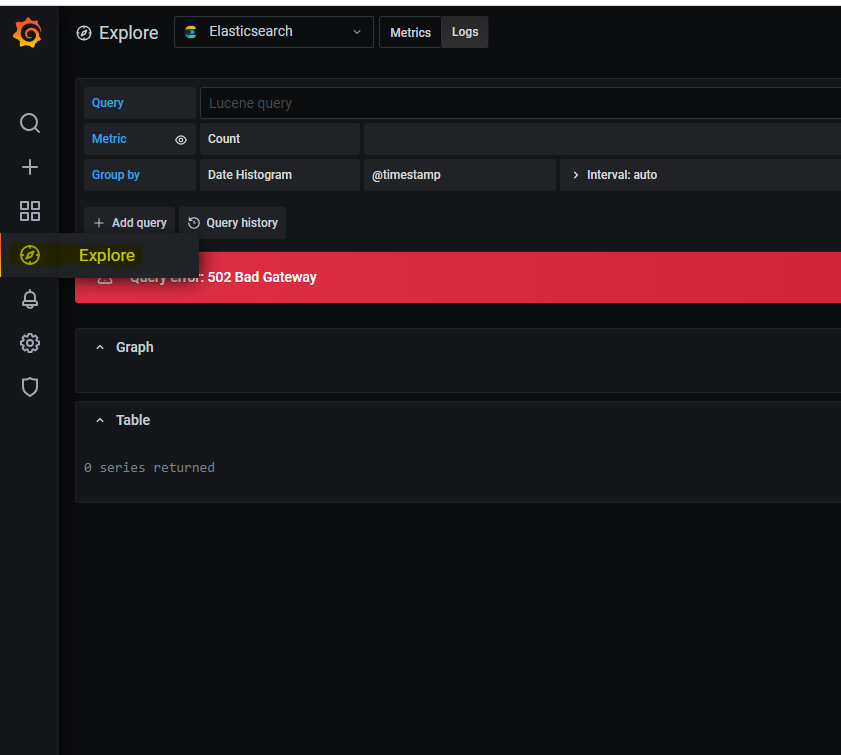
To test your query and your data you can try it out in the “Explore part of grafana”
Thank you very much!
Do you get any results if you only use the source: "/var/log..." part of your query?
Yes, I get some results.
To test your query and your data you can try it out in the “Explore part of grafana”
How exactly can I do this?
You can find the explore option in the menu on the left side:
Do you get results for both these queries?
source:"/var/log/app_event_counter.log" AND message:"PIORECO event count after cleaning is:"
and
source:"/var/log/app_event_counter.log" AND mandant.keyword:"$reco_mandant_name"
I get results in both cases 
But with the complete query you don’t?
I tried once more and I get but not the right results which I can see in Kibana.
Thank you very much for the help!