How to upload dashboards as .json files to kubernetes via helm

Hi all,
I have installed grafana helm chart, and want to pass values to it from a parent chart - i am using prometheus in this way so assume it will also be possible. My directory structure is;

/grafana
   /charts/grafana-6.16.10.tgz
   /dashboards/kubernetes.json
   /values.yaml
   /datasources.yaml

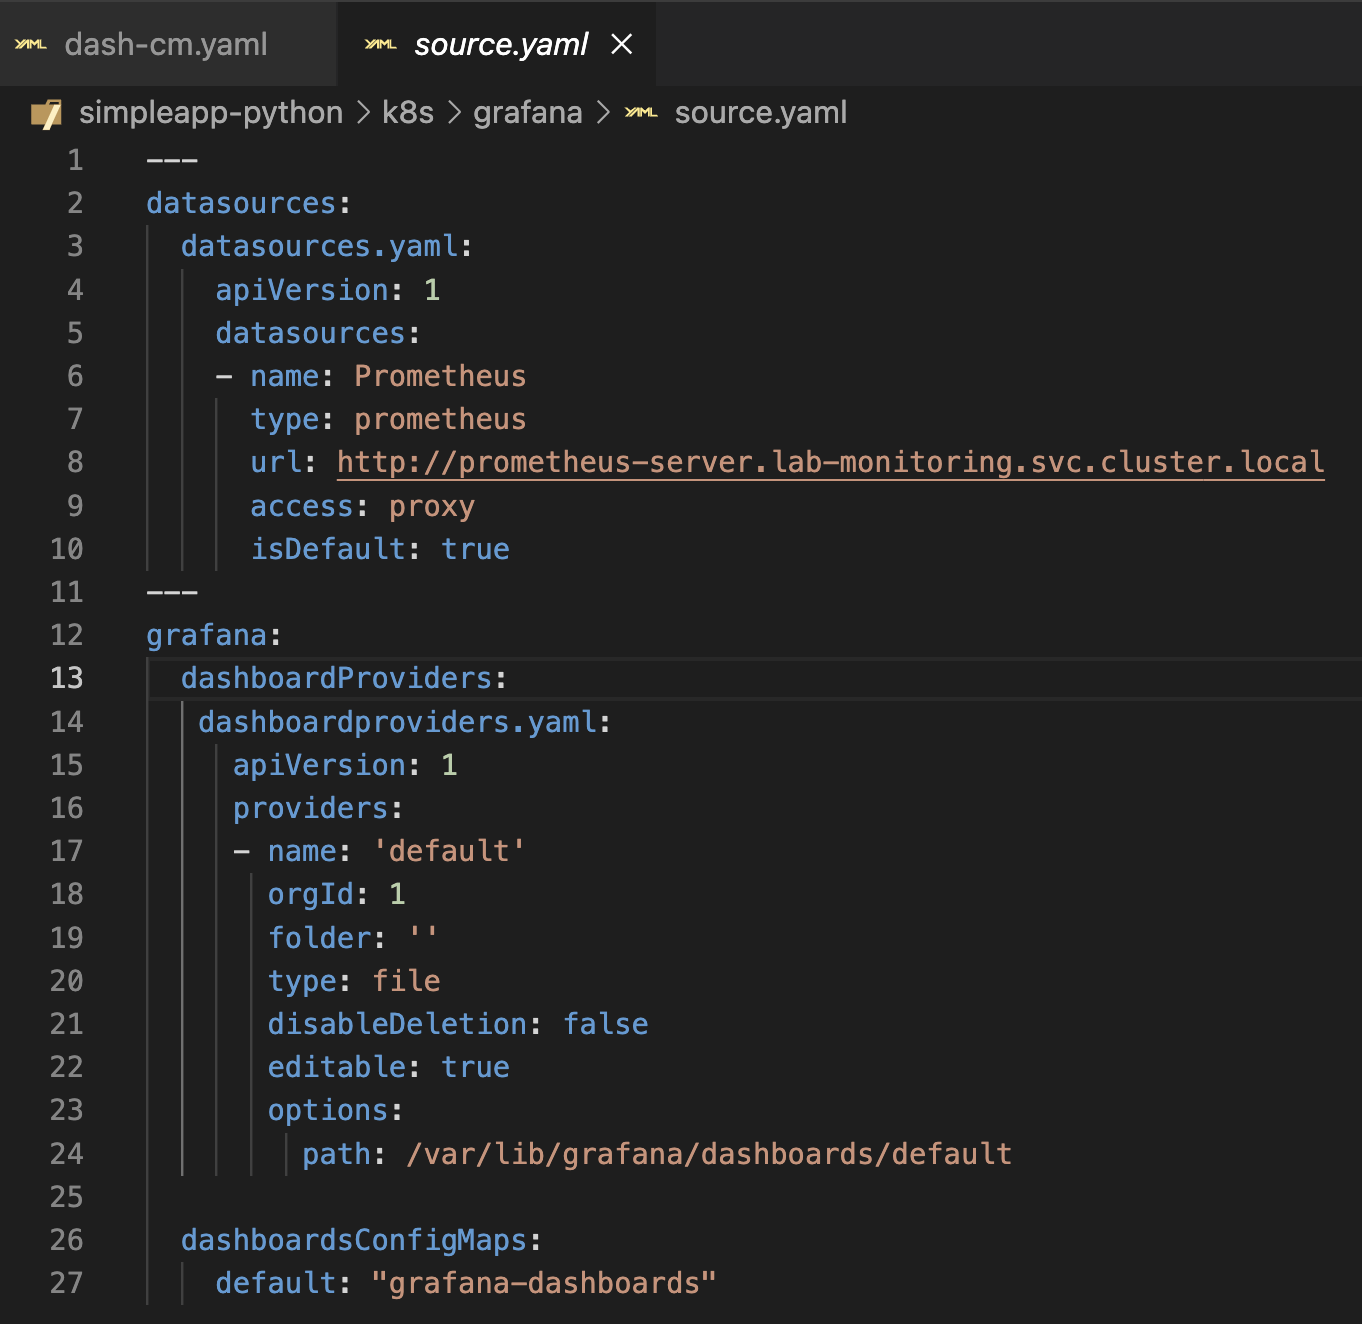
In the values.yaml have;

grafana:
  dashboardProviders:
   dashboardproviders.yaml:
     apiVersion: 1
     providers:
     - name: 'default'
       orgId: 1
       folder: ''
       type: file
       disableDeletion: false
       editable: true
       options:
         path: /var/lib/grafana/dashboards/default

  dashboards:
    default:
      kubernetes:
        file: dashboards/kubernetes.json
      azure:
        gntId: 14986
        version: 1

When running the helm upgrade, it picks up my values.yaml and creates a /var/lib/grafana/dashboards/default directory, however the kubernetes.json it loads is empty, and I get the following error in the log;

lvl=eror msg="failed to load dashboard from " logger=provisioning.dashboard type=file name=default file=/var/lib/grafana/dashboards/default/kubernetes.json error=EOF

Looking through the go code, I can see that it will create a .json if the value is .json, which explains why the empty file is being created.

Iā€™ve also read that it is currently not possible to pass dashboards ā€˜externallyā€™ to the chart, even though we are able to pass datasources.yaml ā€˜externallyā€™. We generate this file using a shell script.

The other suggestion has been to use a sidecar, however in the halm chart default values, the following is written;

## Sidecars that collect the configmaps with specified label and stores the included files them into the respective folders
## Requires at least Grafana 5 to work and can't be used together with parameters dashboardProviders, datasources and dashboards

I do not want to configure our datasources using sidecar, only the dashboards. Does this mean this option is not available to me? Iā€™m at an impasse now, any guidance would be very much appreciated.

Thank you!
Swapna

2 Likes

Iā€™ve managed to get dashboards loading with the following config;

  • create a grafana/values.yaml
grafana:
  dashboardProviders:
   dashboardproviders.yaml:
     apiVersion: 1
     providers:
     - name: 'default'
       orgId: 1
       folder: ''
       type: file
       disableDeletion: false
       editable: true
       options:
         path: /var/lib/grafana/dashboards/default

  dashboardsConfigMaps:
    default: "grafana-dashboards"
  • create a grafana/templates/grafana-dashboard-configmap.yaml
---
apiVersion: v1
kind: ConfigMap
metadata:
  name: grafana-dashboards
  labels:
    grafana_dashboard: "1"
data:
  kubernetes.json: |
{{ .Files.Get "grafana-dashboards/kubernetes.json" | indent 4 }}
  • copy the dashboard json to grafana/grafana-dashboards/kubernetes.json
  • run helm upgrade --install grafana as normal

This will load the configmap from the template in the parent directory, and thus will be able to find the dashboard in the parent folder grafana-dashboards.

Simple really when you know how! Not sure if anyone is reading this but hope it helpsā€¦

4 Likes

This works as well and is much simpler:

grafana:
  dashboardProviders:
   dashboardproviders.yaml:
     apiVersion: 1
     providers:
     - name: 'default'
       orgId: 1
       folder: ''
       type: file
       disableDeletion: false
       editable: true
       options:
         path: /var/lib/grafana/dashboards/default

  dashboards:
    default:
      kubernetes:
        json: |
          ${indent(8, file("${path.module}/dashboards/kubernetes.json"))}
      azure:
        gntId: 14986
        version: 1
3 Likes

Thank you, I will give that a go, however could you please explain what ${path.module} refers to and where the kubernetes.json dashboard needs to reside?

Hi
Can also someone help me to place dashboards that were uploaded through configmap ?
I need to place them in the folder described in dashboardproviders

Currently, my provider looks like this

dashboardProviders:
    dashboardproviders.yaml:
      apiVersion: 1
      providers:
      - name: "infra-dashboards"
        orgId: 1
        folder: 'Infra'
        type: file
        disableDeletion: true
        allowUiUpdates: true
        options:
          path: /tmp/dashboards/grafana-dashboards
dashboardsConfigMaps:
  infra-dashboards: "grafana-dashboards"

The folder was created, dashboards also appeared but in the Default folder not it Infra folder.

Can someone tell me what Iā€™m doing wrong?

${path.module} is an expression from Terraform

path.module is the filesystem path of the module where the expression is placed.

If you want, instead of

${path.module}/dashboards/kubernetes.json

you can use

./dashboards/kubernetes.json

You gonna loose some level of portability but it still gonna work

The path is incorrect. From the helm chart itself you can read:

Configure grafana dashboard providers
ref: Provision Grafana | Grafana documentation
path must be /var/lib/grafana/dashboards/<provider_name>

https://github.com/grafana/helm-charts/blob/main/charts/grafana/values.yaml

Try to copy-paste examples from the documentation. Check whether it works for you and then modify it for your needs.

1 Like

Thanks, I think I had tried that originally but the issue was that that path, either of;

dashboards/kubernetes.json
./dashboards/kubernetes.json

is referred from within the child helm chart rather than the parent chart, and I did not want to store my dashboards there as that helm chart is zipped up and therefore difficult to PR. So the only way I could get the parent chart to pick up dashboards was to configure them as configmaps.

Appreciate your assistance!

1 Like

What if you want to upload multiple dashboards, is there a way to do this?
This approach works for just one dashboard, but it would be nice if one was able to upload several into one folder.

Any ideas anyone, please?

Iā€™m using Terraform and I found a way to upload multiple dashboards building on @rafzukow 's answer.

Create a folder with the json files in it at the root of the Terraform module - I called it ā€œcustom_dashboardsā€.

Make the values file a Terraform template with a .tftpl suffix.

Use the helm_release provider to create the installation - I used kube-prometheus-stack with grafana as a subchart:

resource "helm_release" "monitoring" {
  name  = "prometheus"
  repository = "https://prometheus-community.github.io/helm-charts"
  chart = "kube-prometheus-stack"
  namespace = "monitoring"
  values  = [templatefile("${path.module}/helm/prometheus-values.tftpl", {
    custom_dashboards = fileset("${path.module}/custom_dashboards/", "*.json"),
    module_path = path.module
  })]
}

Then in the template file under the Grafana values under the dashboardProviders key:
prometheus-values.tftpl

  dashboardProviders:
    dashboardproviders.yaml:
      apiVersion: 1
      providers:
      - name: 'default'
        orgId: 1
        folder: ''
        type: file
        disableDeletion: true
        editable: true
        options:
          path: /var/lib/grafana/dashboards/default
  dashboards:
    default:
      %{ for dashboard in custom_dashboards ~}
${indent(4, replace(replace(dashboard, ".json", ""), "./", ""))}:
        json: |
          ${indent(8, file("${module_path}/custom_dashboards/${dashboard}"))}
      %{ endfor }

This way Terraform will dynamically pick up the json files in the directory and load them into the values file. I left folder blank since I want them to go into my General folder, however it should work if you specify a value there to get them in a separate folder.

2 Likes

Actually we can do this without using configmap, in your case you are getting empty in kubernets.json because ā€œfile: dashboards/kubernetes.jsonā€ is a path to a file inside the dashboards directory inside the chart directory . So, you need to pull the helm chart and you push your own dashboards into dashboards directory and this worked for me.

We do not use configmap because if we add new dashboads each time we need to create configmap for that. so ā€¦

I hope this finds helpful for atleast 1 person

Hi @swaps1 I am trying to follow your method to import the dashboards, Iam using the grafana helm chart as a dependency chart to my application. When you say " * create a grafana/templates/grafana-dashboard-configmap.yaml" Did you create this after downloading the grafana helm chart or in a different chart ? And the same question with the configmap

Hi @gnutakki My grafana helm chart is downloaded as a zip file and stored in the root grafana helm directory
grafana/charts/grafana-6.16.10.tgz
I have put the configmap yaml template in grafana/templates/grafana-dashboard-configmap.yaml and yes this was created after I downloaded the helm chart and lives separately to the zip file in grafana/charts/. This way I can download the latest charts and still overlay with my own templates and dashboards. The dashboards referred to in the configmap yaml live in;
grafana/grafana-dashboards/dashboad1.json

The helm install/upgrade will then load the chart from the zip file, and overlay with anything in the templates folder. As the template can use the .Files.Get to refer to local files, it can look in the grafana-dashboards folder for any new dashboards. Simply add your dashboards.json into this folder and update the template to look for this new dashboard.

Hope it makes senseā€¦ happy to elaborate if needed!

I only have to add a couple of lines into the template to pick up the new dashboard, but if your way is easier for you that is great. I know it is possible that way, but I like having the custom bits separate from the zipped chart so we can a) easily PR them and b) download the latest zip charts separately without having to customise them.

@missswapna Also another question, did you have to make any other changes ? like rbac or volume mounts?

Hi, how are you?

Can you help me out by describing what step by step you did (in lines of code if possible) to make this work? Iā€™m trying to persist the dashboards but itā€™s not working. I tried to make it work with the information in this topic but still nothing. Donā€™t worry about being detailed, it will help me understand your way of thinking and the details of this setup. Thanks in advance.

Hereā€™s what Iā€™ve done so far


@romuloslv What is the issue that you are facing with this configuration? Can you explain in detail about that

1 Like

@gnutakki no I did not make any other changes related to rbac or volume mountsā€¦

@romuloslv

  • is your configmap getting loaded at all (check with kubectl get cm)
  • check the grafana pod logs for more info
    A lot of my pain points were in the syntax of the .json itselfā€¦ wrong indentation, unclosed brackets etcā€¦ unfortunately the logs are not very explanatory but at least you will be loking in the right place.
    A good way to get around this is to create the dashboard in the UI and export it, then tweak to get it working with helm.

So I got it to work using how @missswapna did it and also two other methods that work

  1. The dashboardProviders and Dashboard
  2. The dashboardsProviders and Configmap reference
  3. Side car container for real time checking and updating the dashboards

I will put them here for future reference in case,

# Setup Data Source (prometheus)
  datasources:
    datasources.yaml:
      apiVersion: 1
      datasources:
        - name: Prometheus
          type: prometheus
          url: http://prometheus-server
          access: proxy
          isDefault: true
  dashboardProviders:
    dashboardproviders.yaml:
     apiVersion: 1
     providers:
      - name: 'app1'
        orgId: 1
        folder: ''
        type: file
        disableDeletion: false
        updateIntervalSeconds: 10 
        allowUiUpdates: true
        editable: true
        options:
          path: /var/lib/grafana/dashboards/app1
      - name: 'app2'
        orgId: 1
        folder: ''
        type: file
        disableDeletion: false
        updateIntervalSeconds: 10
        allowUiUpdates: true
        editable: true
        options:
          path: /var/lib/grafana/dashboards/app2
  dashboards:
    app1:
      app1-dashboard:
        url: http://
    app2:
      app2-dashboard:
        url: http://
# Setup Data Source (prometheus)
  datasources:
    datasources.yaml:
      apiVersion: 1
      datasources:
        - name: Prometheus
          type: prometheus
          url: http://prometheus-server
          access: proxy
          isDefault: true
  dashboardProviders:
    dashboardproviders.yaml:
     apiVersion: 1
     providers:
      - name: 'app1'
        orgId: 1
        folder: ''
        type: file
        disableDeletion: false
        updateIntervalSeconds: 10 
        allowUiUpdates: true
        editable: true
        options:
          path: /var/lib/grafana/dashboards/app1
      - name: 'app2'
        orgId: 1
        folder: ''
        type: file
        disableDeletion: false
        updateIntervalSeconds: 10
        allowUiUpdates: true
        editable: true
        options:
          path: /var/lib/grafana/dashboards/app2
  dashboardsConfigMaps:
    fid: "app1-dashboard"
    zookeeper: "app2-dashboard"
# Setup Data Source (prometheus)
  datasources:
    datasources.yaml:
      apiVersion: 1
      datasources:
        - name: Prometheus
          type: prometheus
          url: http://prometheus-server
          access: proxy
          isDefault: true
# Setup dashboards
  dashboardProviders:
    dashboardproviders.yaml:
     apiVersion: 1
     providers:
      - name: 'app1'
        orgId: 1
        folder: ''
        type: file
        disableDeletion: false
        updateIntervalSeconds: 10 
        allowUiUpdates: true
        editable: true
        options:
          path: /var/lib/grafana/dashboards/app1
      - name: 'app2'
        orgId: 1
        folder: ''
        type: file
        disableDeletion: false
        updateIntervalSeconds: 10
        allowUiUpdates: true
        editable: true
        options:
          path: /var/lib/grafana/dashboards/app2

  securityContext:
    runAsUser: 0
    runAsGroup: 0
    fsGroup: 0
  rbac:
    extraRoleRules:
      # Allow k8s-sidecar image to read ConfigMap objects in same namespace
      - apiGroups: [""]
        resources: ["configmaps"]
        verbs: ["get", "watch", "list"]
  
  extraContainers: |
    - name: collect-dashboard-configmaps-in-directory
      image: kiwigrid/k8s-sidecar:latest
      volumeMounts:
        - name: collection
          mountPath: /tmp/collection
      env:
        - name: LABEL
          value: "dashboard-collect"
        - name: LABEL_VALUE
          value: "grafana-dashboard"
        - name: FOLDER
          value: /tmp/collection
        - name: RESOURCE
          value: configmap
  
  extraVolumeMounts:
    - name: collection
      mountPath: /var/lib/grafana/dashboards/default
      readOnly: true

For (3) the config map should have a label = dashboard-collect

All of these work and are useful in different situations.