-
What Grafana version and what operating system are you using?
- grafana version 12.1.0
- OS: Raspberry Pi OS lite Bookworm
-
What are you trying to achieve?
- Create a dashboard to monitor my lan performance metrics
-
How are you trying to achieve it?
- Python script populates influxdb. Grafana for visualization
- I have created a dashboard and a visualization panel in that dashboard. The panel has a query to fetch the data from the db. The data is fetched correctly.
- I have also, based on instructions online, created a dashboard “variable”.
-
What happened?
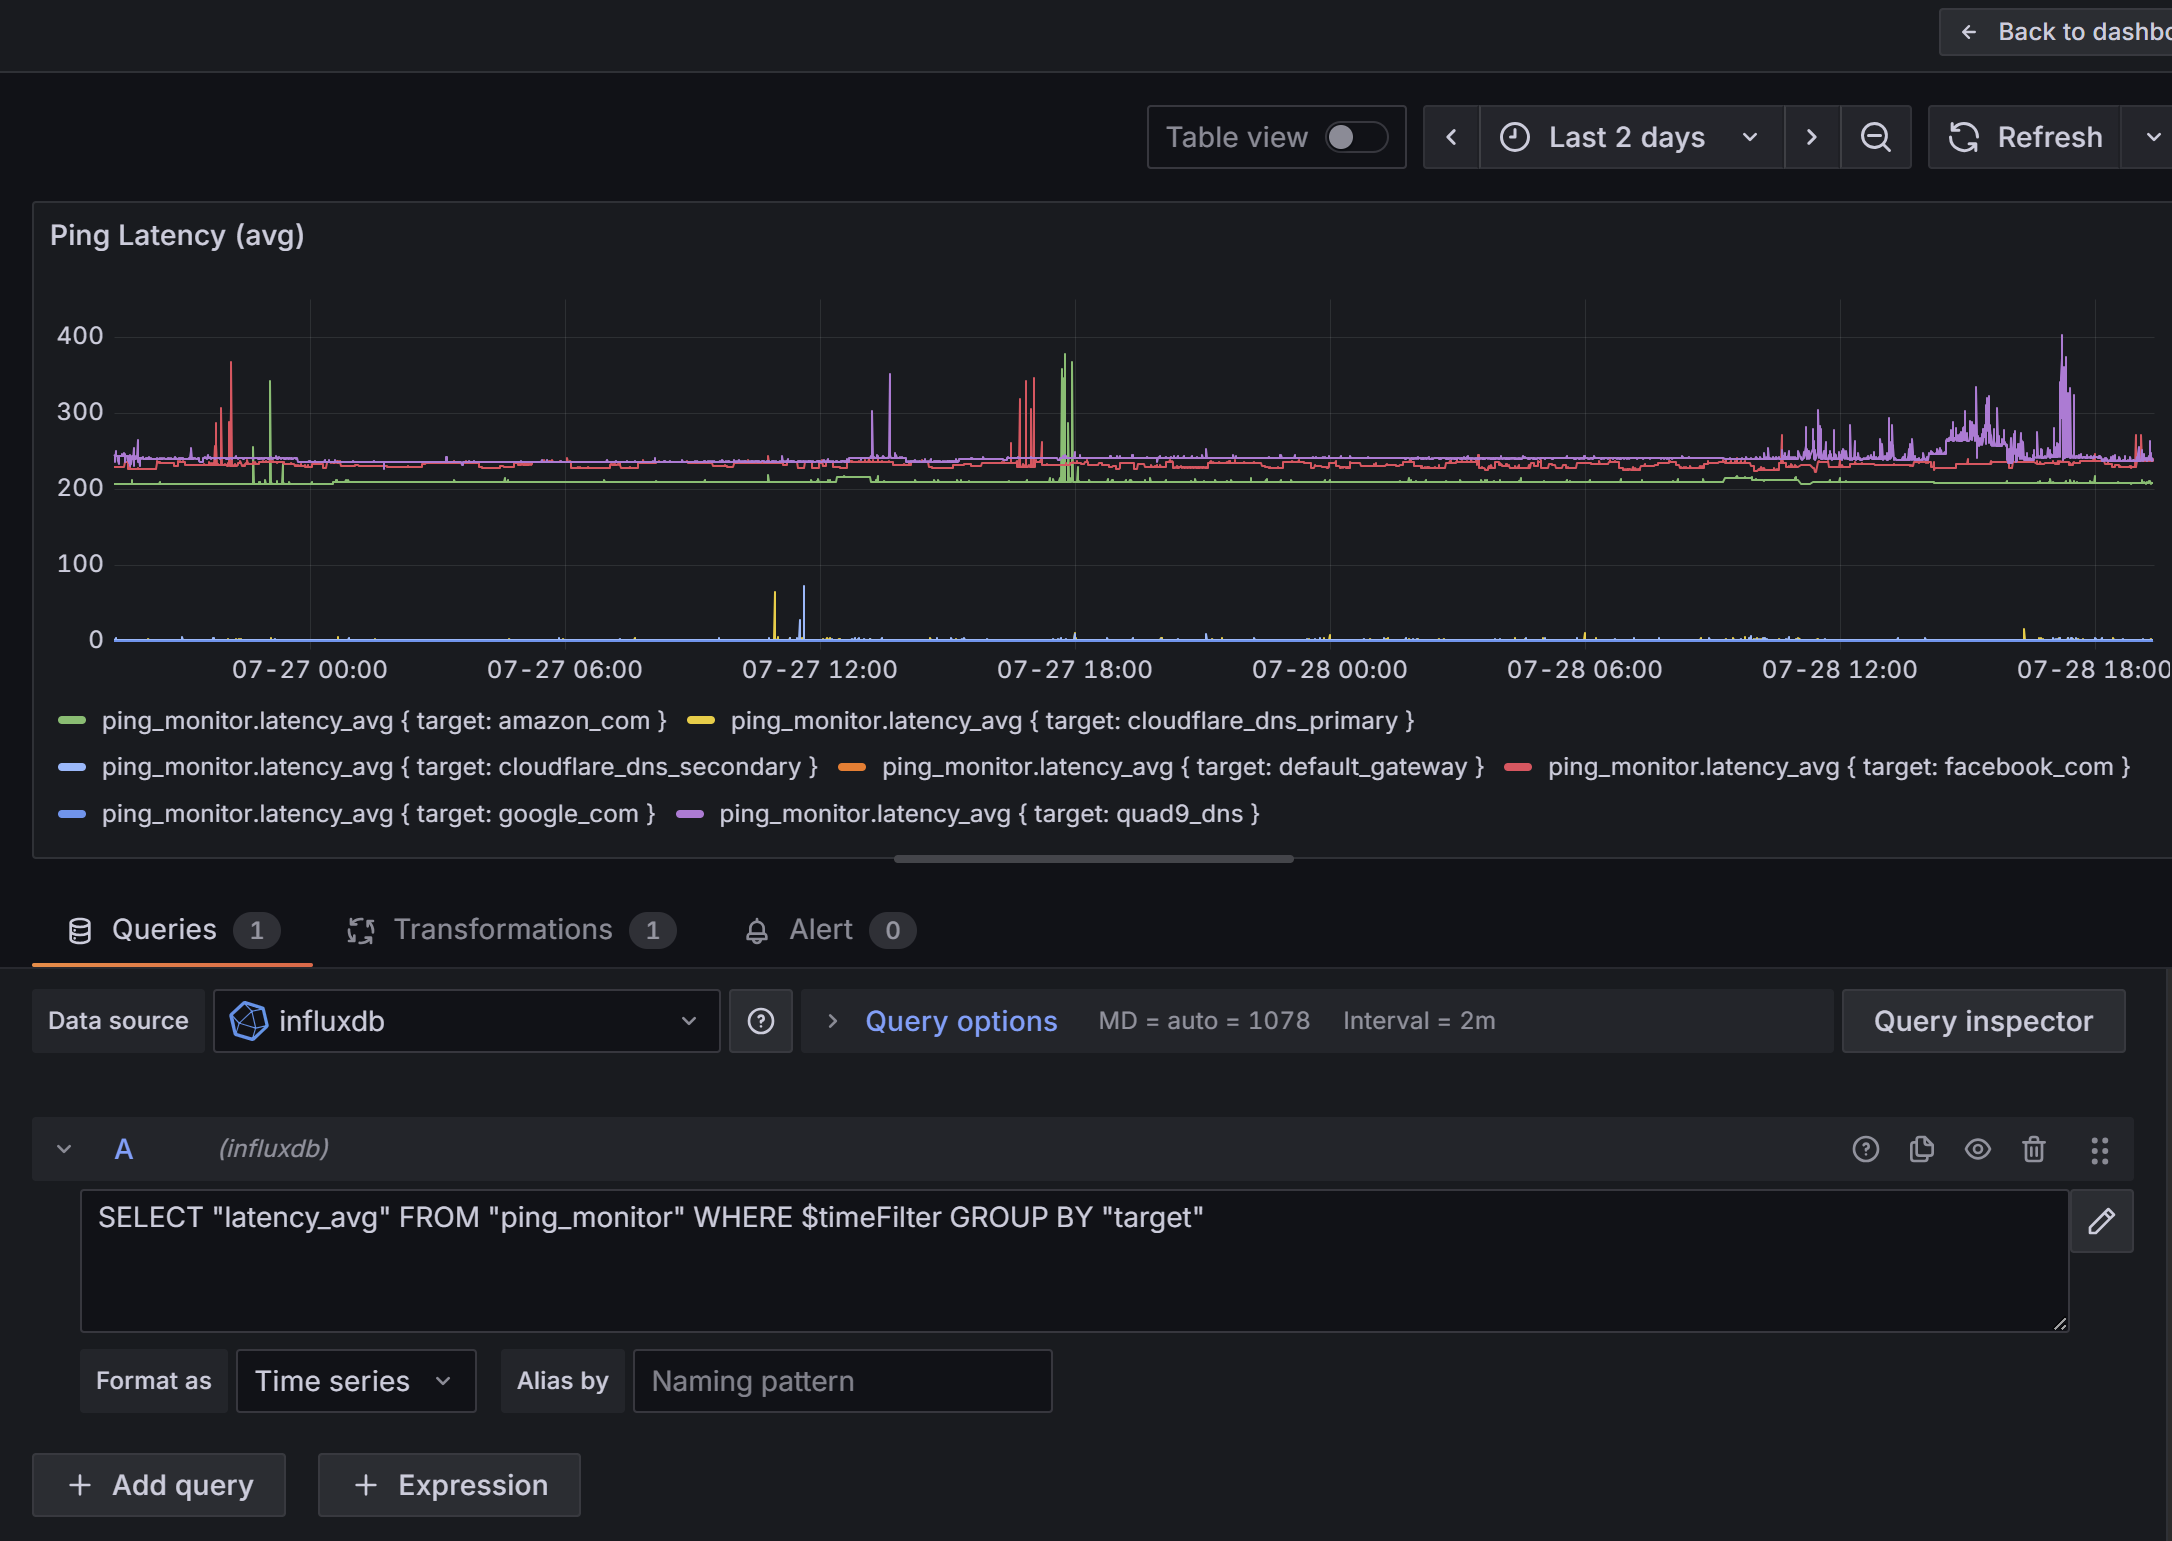
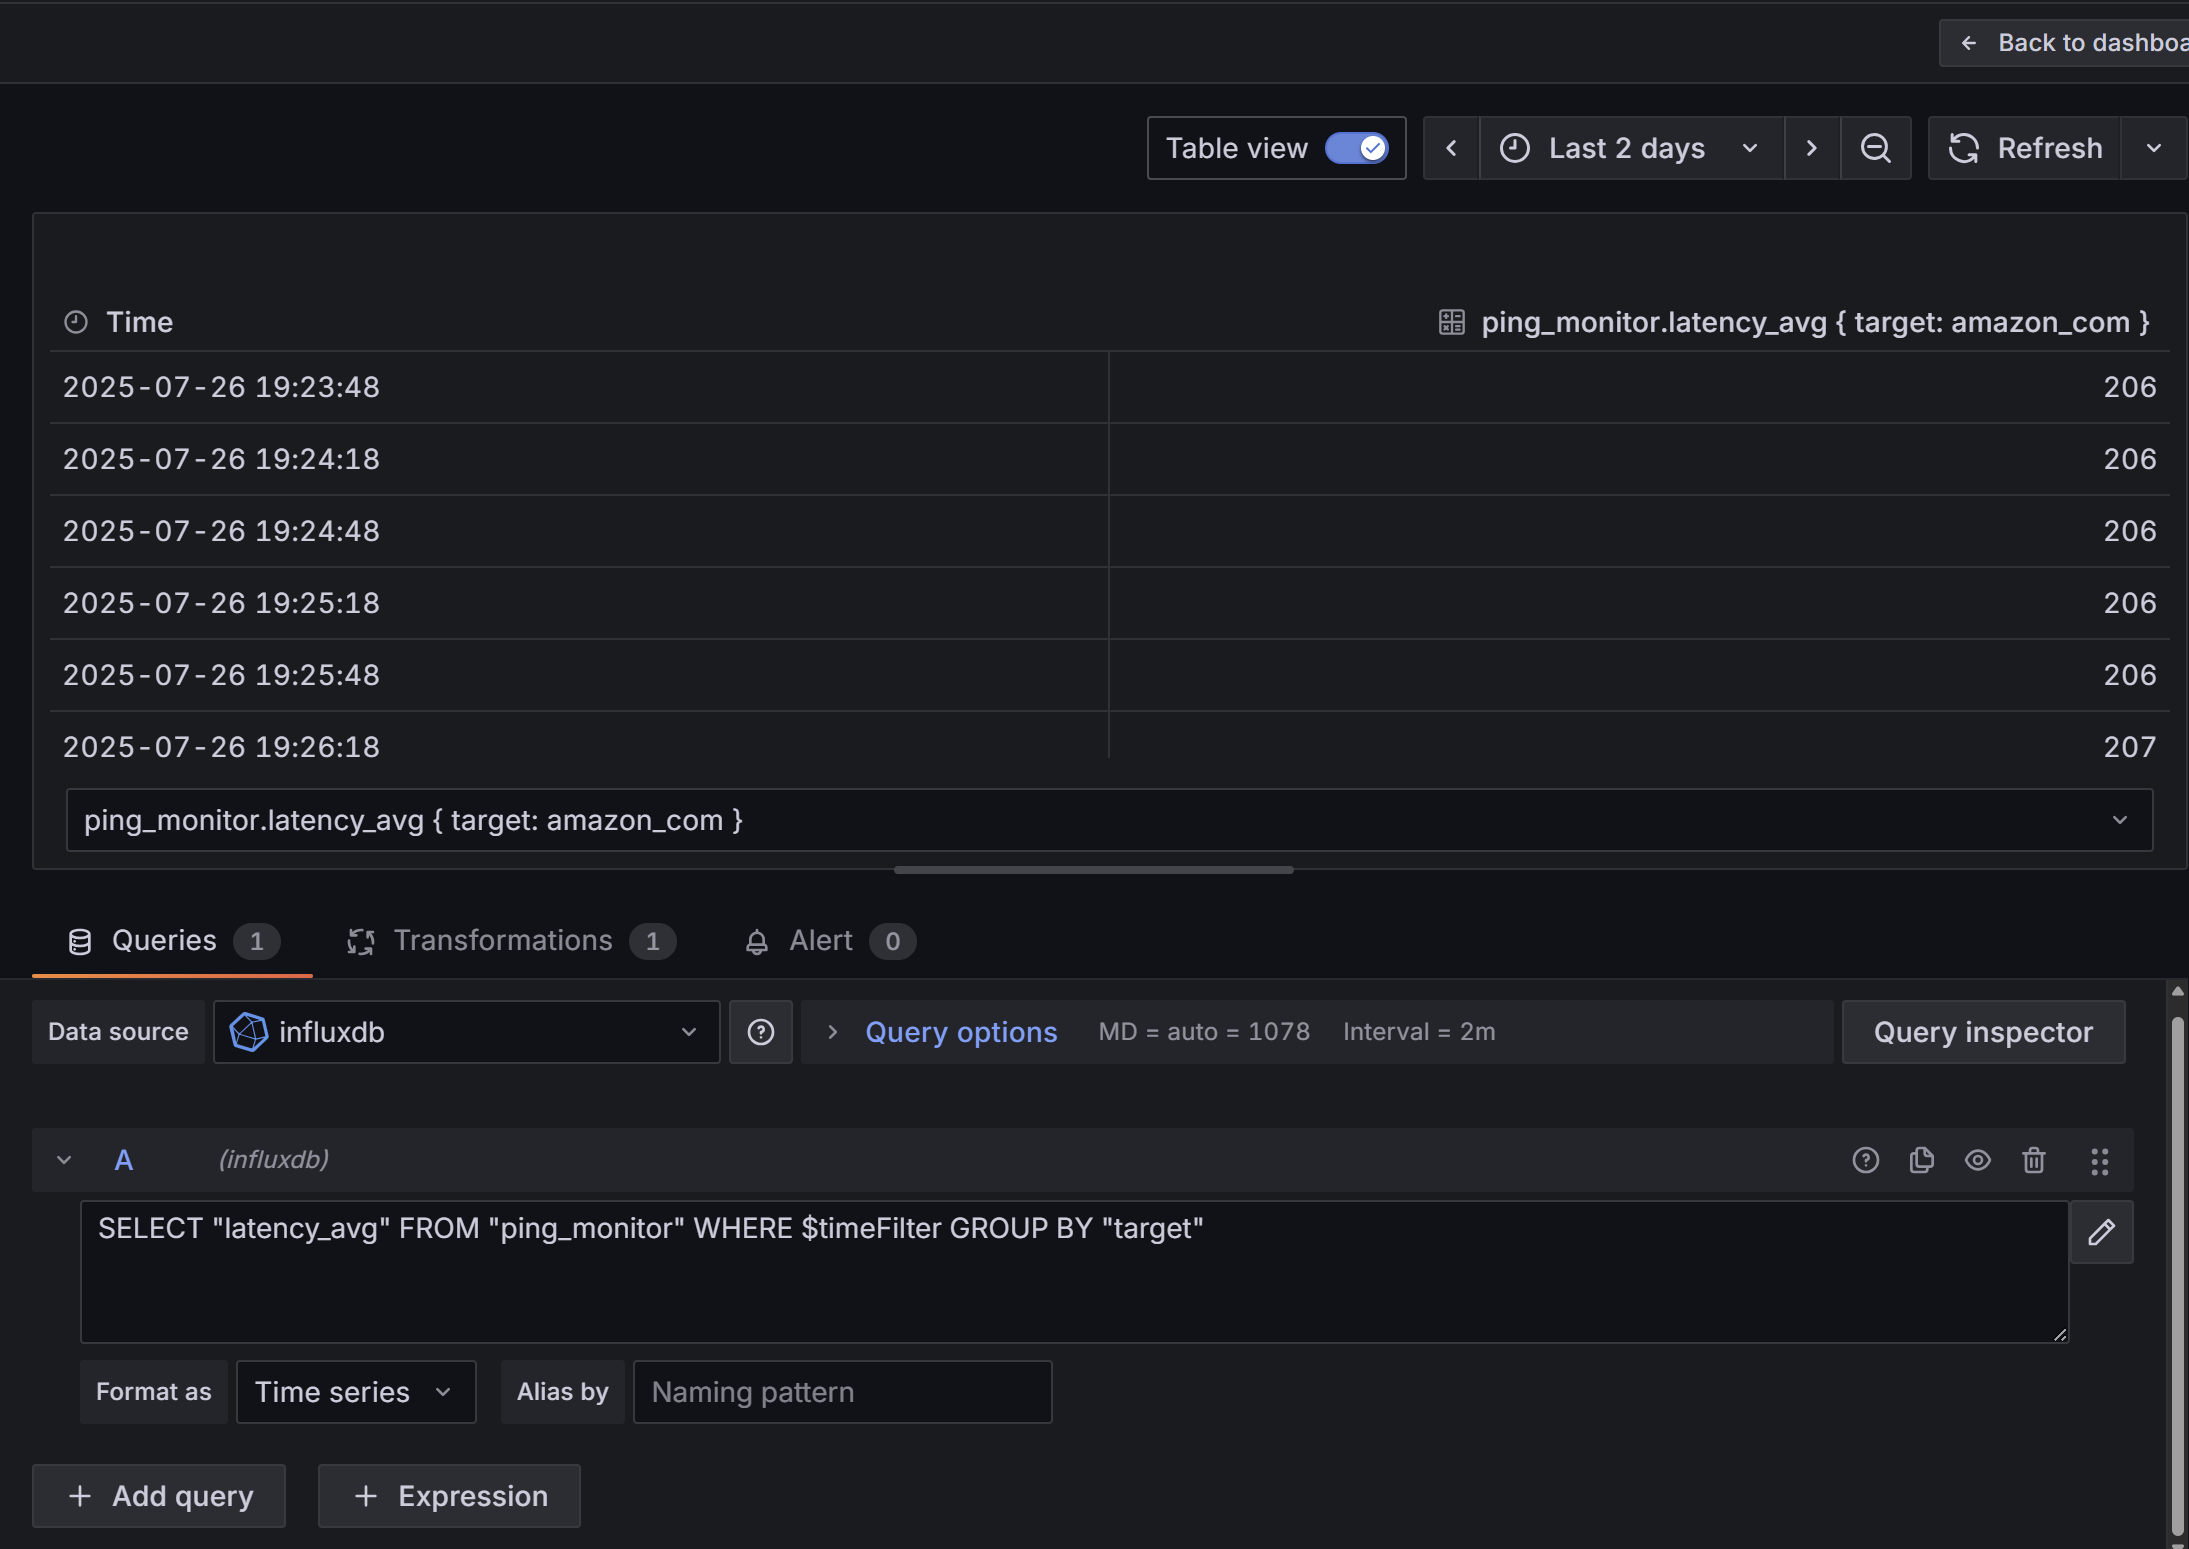
- Data is accessible. I’m attempting to create a Time series chart for ping measurement to various servers. The DB contains “tags” for each server
- If I don’t use any template variable, the legend displays the full content of the db value (f.e.: ping_monitor.latency_avg { target: amazon_com })
- If I use the dashboard variable, it shows a dropdown on the top-left above the chart where I can select one or more series. If I use the variable in the “Alias by Name” field, all the legend options show the value selected in the drop-down.
-
What did you expect to happen?
- The different “tag” series are shown as their own time-series lines in the chart.
- The legend displays the tag name correctly
-
Can you copy/paste the configuration(s) that you are having problems with?
- N/A
-
Did you receive any errors in the Grafana UI or in related logs? If so, please tell us exactly what they were.
** N/A -
Did you follow any online instructions? If so, what is the URL?
- Yes. Multiple locations suggested using custom overrides for each of the series names. But that is not a scalable approach as I have multiple panels as well as I might add new tags in the future which will require adding overrides for each new tag on all panels
- Can you extract a word from within a tag to automatically label the legend?
Screenshots: