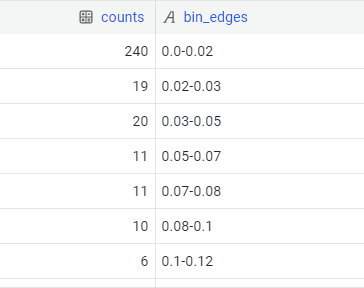
I have bin_edges and bin_counts columns to plot the histogram. The values on x- axis and y-axis doesn’t come up as in the table mentioned.

I have bin_edges and bin_counts columns to plot the histogram. The values on x- axis and y-axis doesn’t come up as in the table mentioned.
