- What Grafana version and what operating system are you using?
Grafana Enterprise Version 9.1.6 (commit: 92461d8d1e, branch: HEAD)
Ubuntu 20.04.3 LTS
- What are you trying to achieve?
I am loading gas price data from a SQLite database of form:
| ID | timestamp            | company | price
| 1  | 2022-09-25T20:00:01Z | Shell   | 2.069
| 2  | 2022-09-25T20:00:01Z | ARAL    | 2.079
...
It is timeseries data from different companies in a single table. I would like to display a every time series of each company in the same panel in Grafana. The number of companies is not known initially, so it must be inferred automatically.
The end result would be:
1.) upon loading the graph, Grafana detects the total number of companies in the data
2.) separates the data into groups for each company
3.) draws a graph in the same panel
- How are you trying to achieve it?
I can draw the time series individually by using the query
SELECT timestamp, price FROM gas_prices WHERE company = "Shell"
or
SELECT timestamp, price FROM gas_prices WHERE company = "ARAL"
This produces something like this:
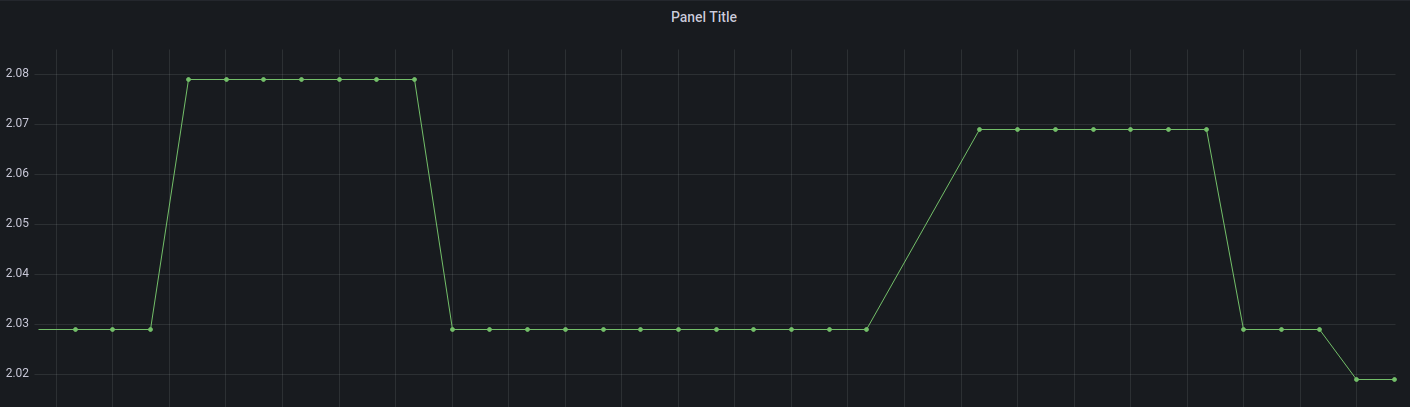
I don’t know how to create multiple plots in the same panel so that I can compare the series values at different points in time.
Also, I only have limited knowledge about advanced SQL queries. I have read somewhere that this might be possible to achieve with these, but I couldn’t find a query to tweak for my problem. Also, there is a possibility that I overlooked a feature in Grafana.
I would be grateful for help on this matter. Thanks!