How to add columns to timeseries Legend?

Hi!

I use Grafana v10.2.3 with influxdb and telegraf plugin for monitoring my Proliant via ipmi_sensor (ILO3)

I have this query in Flux:

from(bucket: "telegraf")
  |> range(start: v.timeRangeStart, stop:v.timeRangeStop)
  |> filter(fn: (r) => r["_measurement"] == "ipmi_sensor")
  |> filter(fn: (r) => r["host"] == "sauron.homelab")
  |> filter(fn: (r) => r["name"] == "temp_2" or r["name"] == "temp_3" or r["name"] == "temp_15" or r["name"] == "temp_16" or r["name"] == "temp_18")
  |> filter(fn: (r) => r["server"] == "${server}")
  |> drop(columns: ["entity_id", "host", "server", "unit"])
  |> aggregateWindow(every: v.windowPeriod, fn: mean, createEmpty: false)
  |> yield(name: "mean")

This query return some temperatures and informations about the sensor like this:

I display the data in a time series graph with a legend like this

I put one transform (Label to fields) to get the sensor name in legend like this:

Now my question:
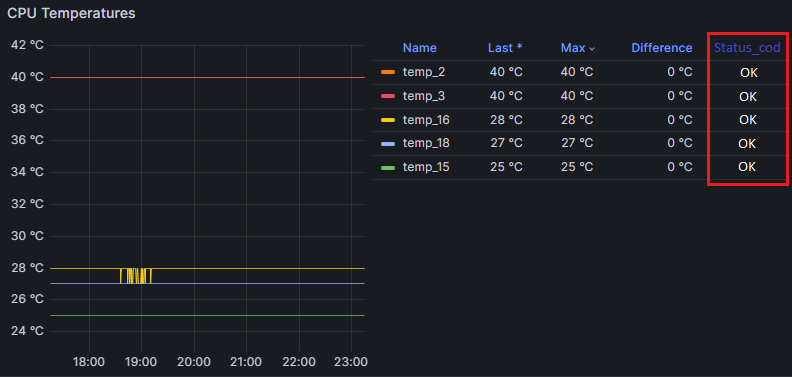
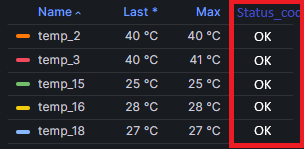
In the data returned by the query, I get the “status_code” in the value header (see first image) and I want to put the status code directly in my legend just after “difference” column.
With my awesome paint skills I made what I want (in red border) :slight_smile: :

It’s possible to add the data in the time series legend ?
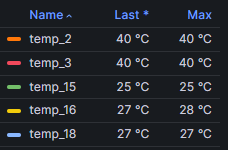
I’ve tested multiple transform combination but I never got the status_code data in the legend values list (this list below):
image

Thank you for your advice !
Cripsii

Welcome @Cripsii to the Grafana forum and thank you for such an excellent description of your issue.

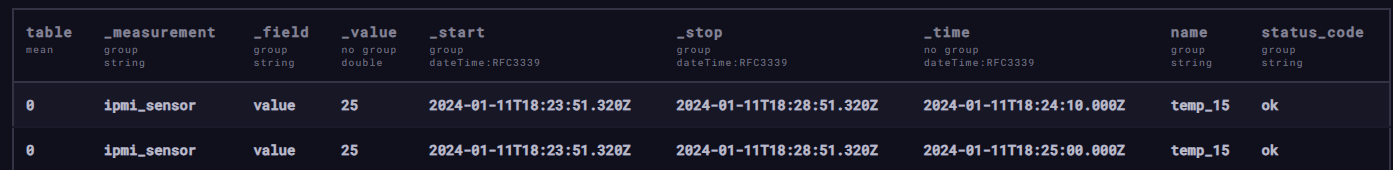
What do you see in Influx Data Explorer with this query? Could you export a snippet of the data being returned (as a .csv) and paste here? That will allow others to hone in on a solution (which I am pretty sure is possible).

from(bucket: "telegraf")
  |> range(start: v.timeRangeStart, stop:v.timeRangeStop)
  |> filter(fn: (r) => r["_measurement"] == "ipmi_sensor")
  |> filter(fn: (r) => r["host"] == "sauron.homelab")
  |> filter(fn: (r) => r["name"] == "temp_2" or r["name"] == "temp_3" or r["name"] == "temp_15" or r["name"] == "temp_16" or r["name"] == "temp_18")
  |> filter(fn: (r) => r["server"] == "${server}")
  |> drop(columns: ["entity_id", "host", "server", "unit"])
  |> aggregateWindow(every: v.windowPeriod, fn: mean, createEmpty: false)
  |> yield(name: "mean")

Hi @grant2,

you can see a snippet of raw data returned by the query.

I get the same result in grafana. I think my problem is about the convertion of data.
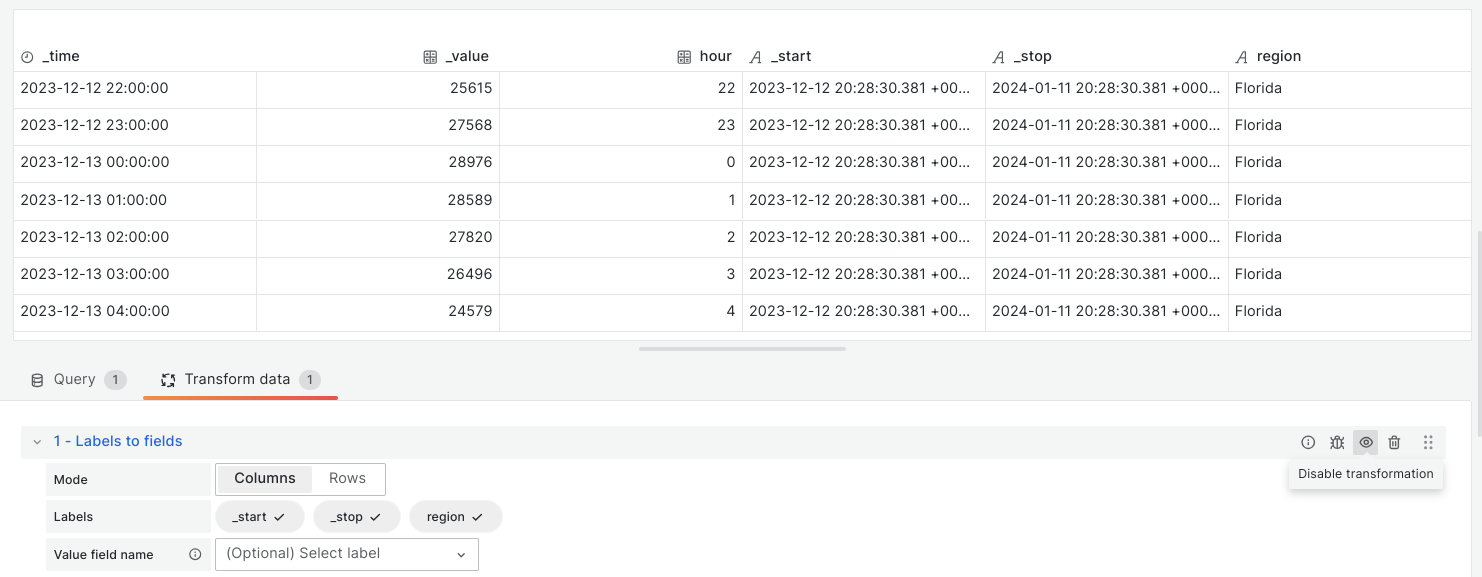
I only manage to change value of the column “name” (to put the name on sensor in) with the transform “Label to fields”.

Regards

I feel like the Labels to Fields transformation should work.

Here is an example from my data:
without transformation:

with transformation:

Comparing your screenshot with mine, can you make this section blank (like I have done below in yellow)?
image

Hello,

I’ve the same result as you with my tranform. I can have the “status_code” column in the table data:

In the tranform Labels to fields, selecting anything in the yellow select chahge the legend column “name” in my time series. It’s Ok for that and it’s a behavior a want to. I selected “name” to identify the sensor name in my legend.
without yellow field selected :
image
With "name"selected in yellow field:
image

So far I get all I want, but now I want to show my status_code in the legend of time series but i’m unable to achieve this

This is exacly what I want, Adding status_code column in legend:
Screenshot 2024-01-12 093355

Regards,

Hi @Cripsii

Thanks for clarifying (I completely missed the fact that you are trying to format the legend…I was focused on the results table). I played around with some test data and cannot find a way to get the legend to display that status_code. It might be possible using some more a 3rd party plugin.