Hi,
I have a stacked graph with 3 queries. When I export the data via CSV I get 3 data series. So assuming the data looks like this for a couple of days:
5/1/2018 Series1 45
5/2/2018 Series1 34
5/1/2018 Series2 75
5/2/2018 Series2 99
5/1/2018 Series3 55
5/2/2018 Series3 22
I would like to also plot a ‘Totals’ series so that I can get that totals also as part of the CSV export.
5/1/2018 Series1 45
5/2/2018 Series1 34
5/1/2018 Series2 75
5/2/2018 Series2 99
5/1/2018 Series3 55
5/2/2018 Series3 22
5/1/2018 Totals 45+75+55
5/2/2018 Totals 34+99+22
Is there a way to achieve that?
Hi @manooduo
You should query:
SELECT sum(“value”) FROM “testsum” WHERE (“hostname” = ‘Series1’ OR “hostname” = ‘Series2’ OR “hostname” = ‘Series3’) AND $timeFilter GROUP BY time($interval)
(testsum = table).
Have a nice day ^^
Sorry @manooduo
I inserted sample data with timestamp today 
insert testsum,hostname=Series1 value=45 1530669900000123456
insert testsum,hostname=Series1 value=34 1530670200000123456
insert testsum,hostname=Series2 value=75 1530669900000123456
insert testsum,hostname=Series2 value=99 1530670200000123456
insert testsum,hostname=Series3 value=55 1530669900000123456
insert testsum,hostname=Series3 value=22 1530670200000123456
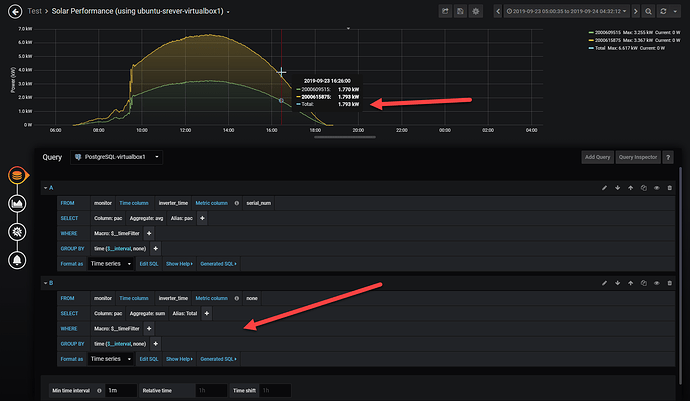
This does not seem to work in 6.3.6. I ended up try to accomplish this by creating a separate query, but the graph datapoints don’t seem to match up. See image below.
Perhaps there is an easier way or maybe I need to submit a feature request. It would be nice to have a total for stacked bar graphs to be be displayed as one of the arrays returned.
1 Like
