This may or may not be prometheus specific, but here it goes anyway.
When exporting metrics, Prometheus adds a job and instance label to the exported metrics, which are a nuisance when displayed in the panel legend or in the whatever-it’s-called-that-pops-up-when-the-cursor-hovers-over-the-graphed-metrics.
Worse, even if I select a metric by label, that label still gets displayed. For example, when scraping metrics from prometheus-node-exporter and want to display, say, the utilization of the root filesystem, I don’t really need to see that all my metrics have device="/dev/sda1",fstype="ext4",mountpoint="/"!
Is there some way to suppress those?
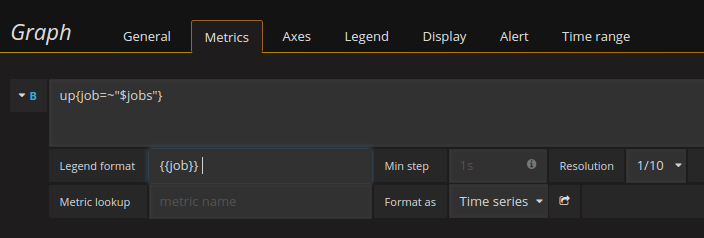
What do you have in the Legend format field?
See this demo panel for an example of using the Legend format field to change both the legend and the hover tooltip:
http://play.grafana.org/dashboard/db/3-promcon-templating?panelId=6&fullscreen&edit&orgId=1
Docs: Prometheus data source | Grafana documentation
Thanks; this is even better than what I needed, and definitely easier than relabeling in Prometheus. Is it a newer feature? I upgrade routinely, but I don’t always look at the newer features, although I should 
Thanks again
/-/
I think it has been there from when the prometheus data source was created more than 2 years ago 
Grafana is full of small features so it is easy to miss one.
Is this still possible? I don’t think the UI contains a legend format field anymore. 
Or is this a Prometheus-only feature? I’m using InfluxDB.