-
What Grafana version and what operating system are you using?
Grafana 9.0.1 on Raspberry Pi3 debian -
What are you trying to achieve?
Want to show diagram from *excatly 06:00 to 22:00 o’clock of the same day. 06:00 is working, but I don’t understand how to get 22:00 as the end. It always takes much more data.
see the right part of screenshot, it is beyond 22:00

-
How are you trying to achieve it?
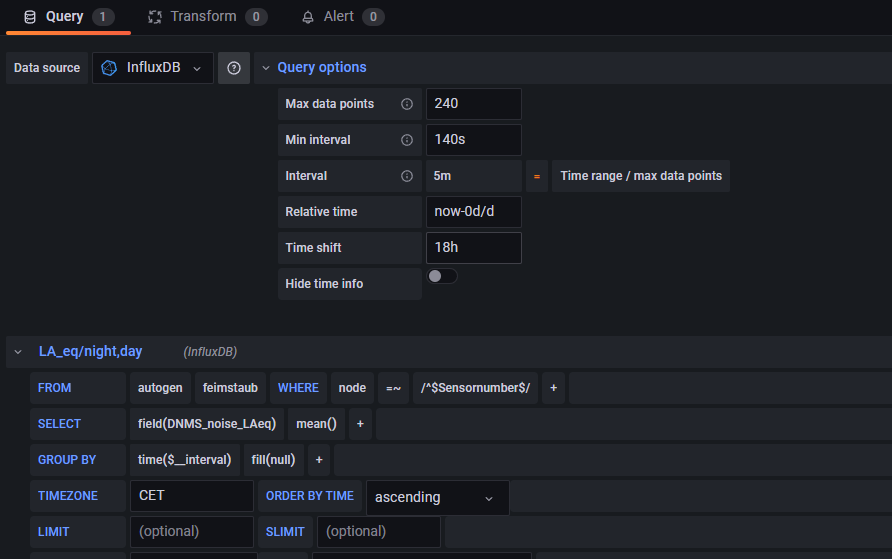
This is my setup of the diagram
-
What happened?
the right part of diagram is beyond 22:00 -
What did you expect to happen?
anybody to tell me the trick how to let my data end at 22:00 -
Can you copy/paste the configuration(s) that you are having problems with?
see screeny -
Did you receive any errors in the Grafana UI or in related logs? If so, please tell us exactly what they were.
now -
Did you follow any online instructions? If so, what is the URL?
none.
Any hint or help is highly appreciated and I hope I’ll be able to give the support back later.
THX,
Daisy