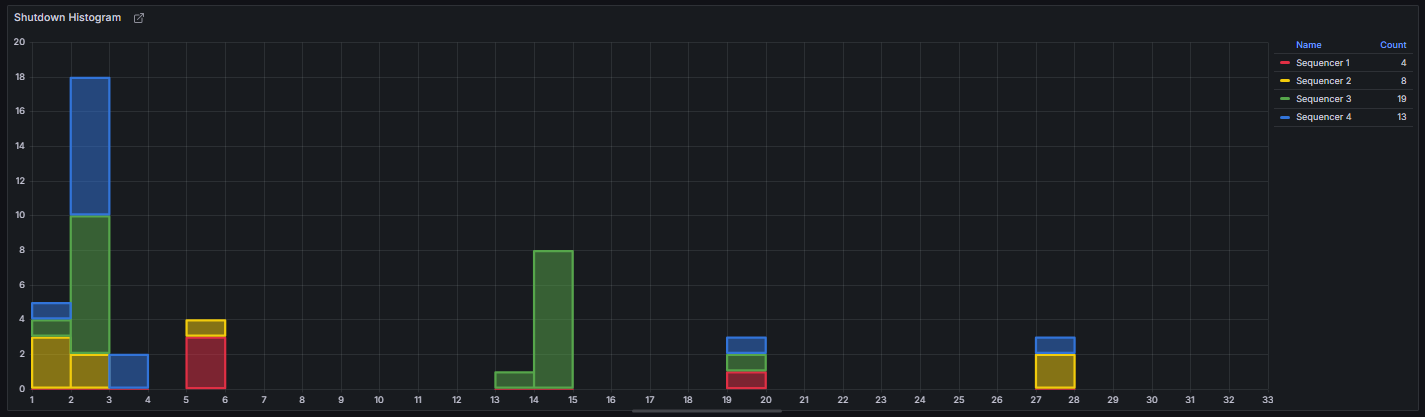
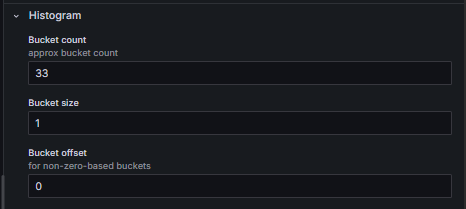
I created a histogram with a bucket count of 33 (because there are 32 possible values), bucket size of 1, and an offset of 0 so the graph appears something like this:
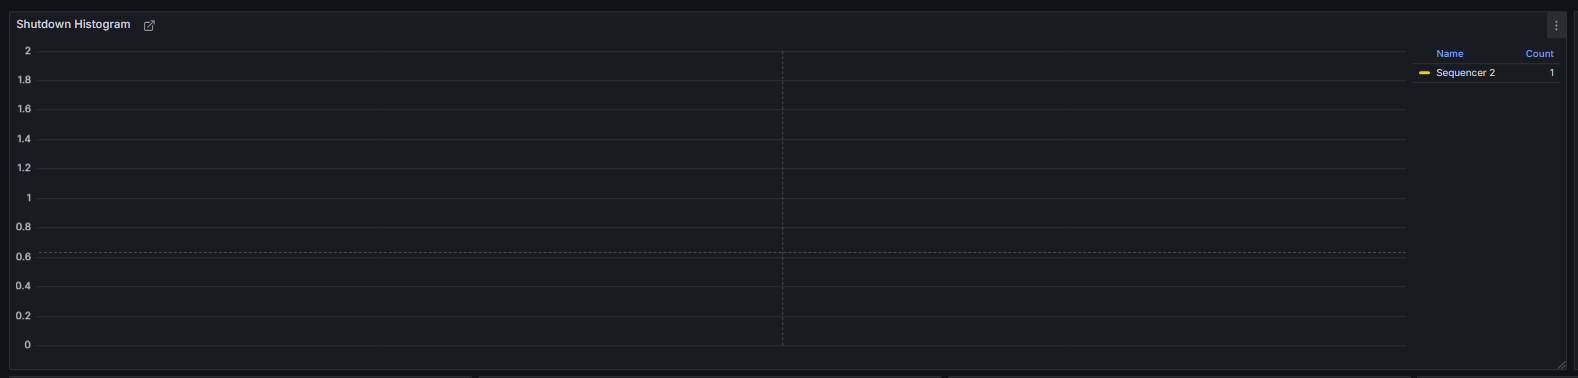
But sometimes when I look at a small time range, the bucket size changes even though I have the bucket width set to 1 and other times, the X-axis completely disappears and won’t show the histogram at all:

When there is a shutdown, I would expect the histogram to look like the first screenshot of this post where you can see 1 space buckets 1-33 regardless of the time range selected.
I’m using Grafana Cloud version v11.3.1 and using InfluxDB_SODA datasource.