Please bear with me as I am a feeble old man. I do not understand how this works.
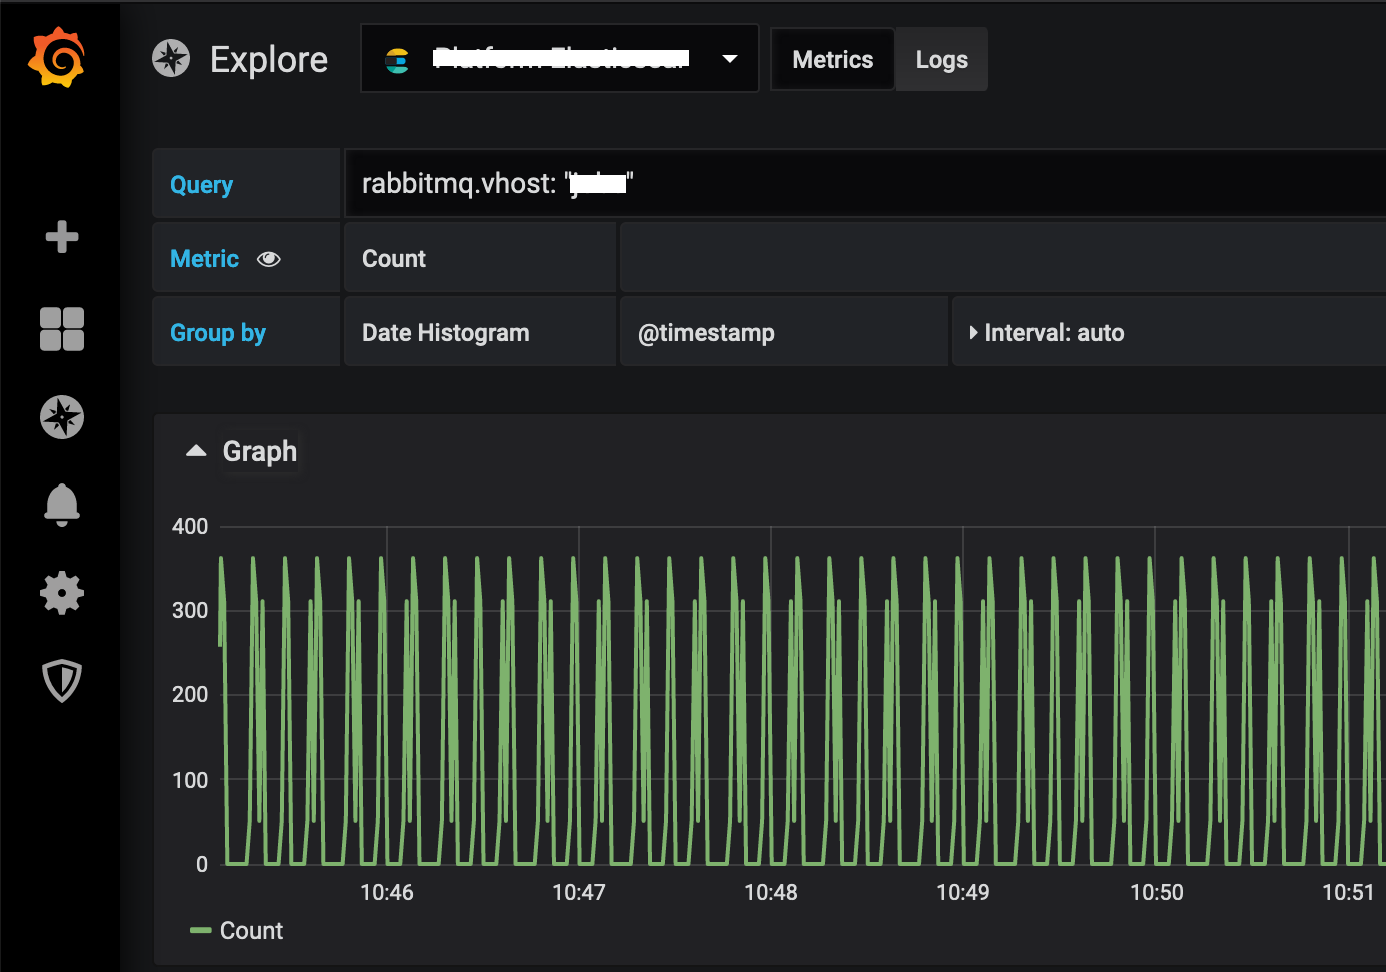
By default it will Group by Date Histogram. Why would we do this? Why group by anything at all if we are just counting documents over time? Anyway, it looks like it is returning documents, because I can see a line on the graph here.
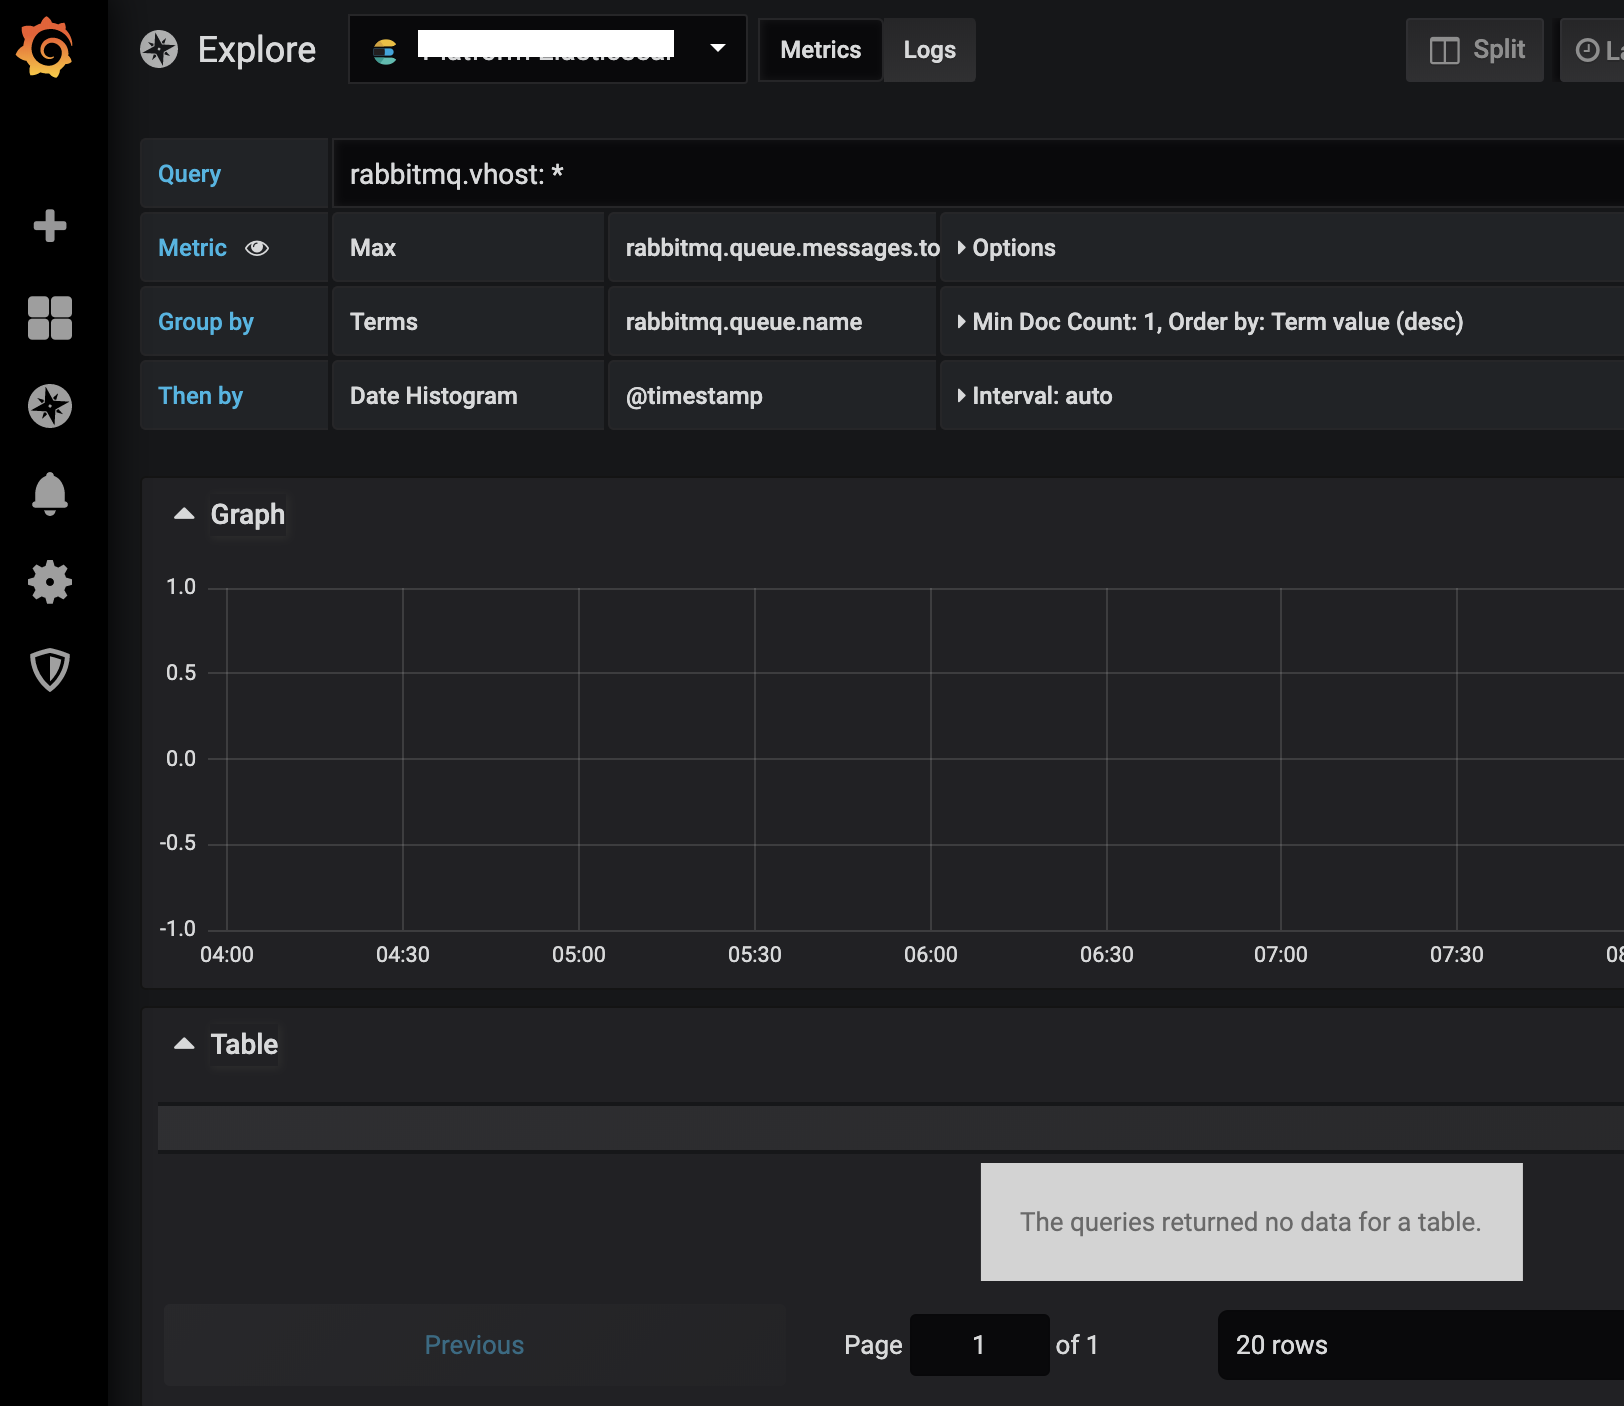
I want to group by rabbitmq.queue.name, and display a count of the number of messages on each of these queues. What would this look like in Grafana? Whenever I Group by Terms, the query returns no documents. There is nothing on the graph, whether the Metric is set to Count (of documents I assume) or to Max of rabbitmq.queue.messages.total.count