I am trying to use Graph panel to show data from outside of the specified date range in the date picker and it is failing to display data.
For example, the date picker is set to show stats for the last 72 hours, yet I want one graph panel to show data persistently (despite what date range in specified in date picker) for the last 7 days.
I use MSSQL as data source and I have the query ready and it shows necessary data in rows.
Can someone share some tips on how one can achieve this?
I don’t know if I get it right but, in the panel that you do not want to use the range just do not use it in the query (where clause) or if you want to show some data in the same query that has the time clause use a subquery to bring the data. You can still bring some data into a column and hide the display by putting it in the hidden style.
Anything puts a picture of what you want to do to make understanding easier.
Hi serge1,
Grafana has a feature that allows you to override the time for each panel, this option is found at the bottom of the tab of queries, you should only put 7d
I have a problem where I’m not using the where clause javascript thing, but when I manipulate the date range picker the panel updates the time range to that.
How can I prevent this from happening?
David Buttrick
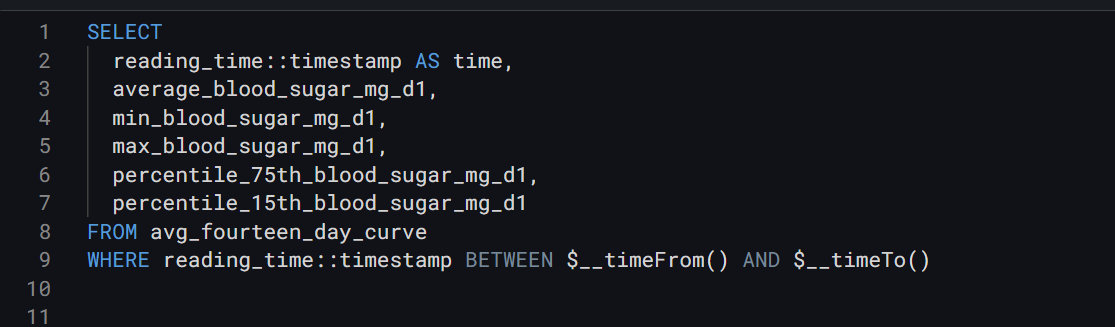
My query returns an interval of 24 hours in 5 minute slices. The reading_time field is a text field, that I have to transform into a time field in grafana.