I was trying out multi dimensional alerts feature on grafana.
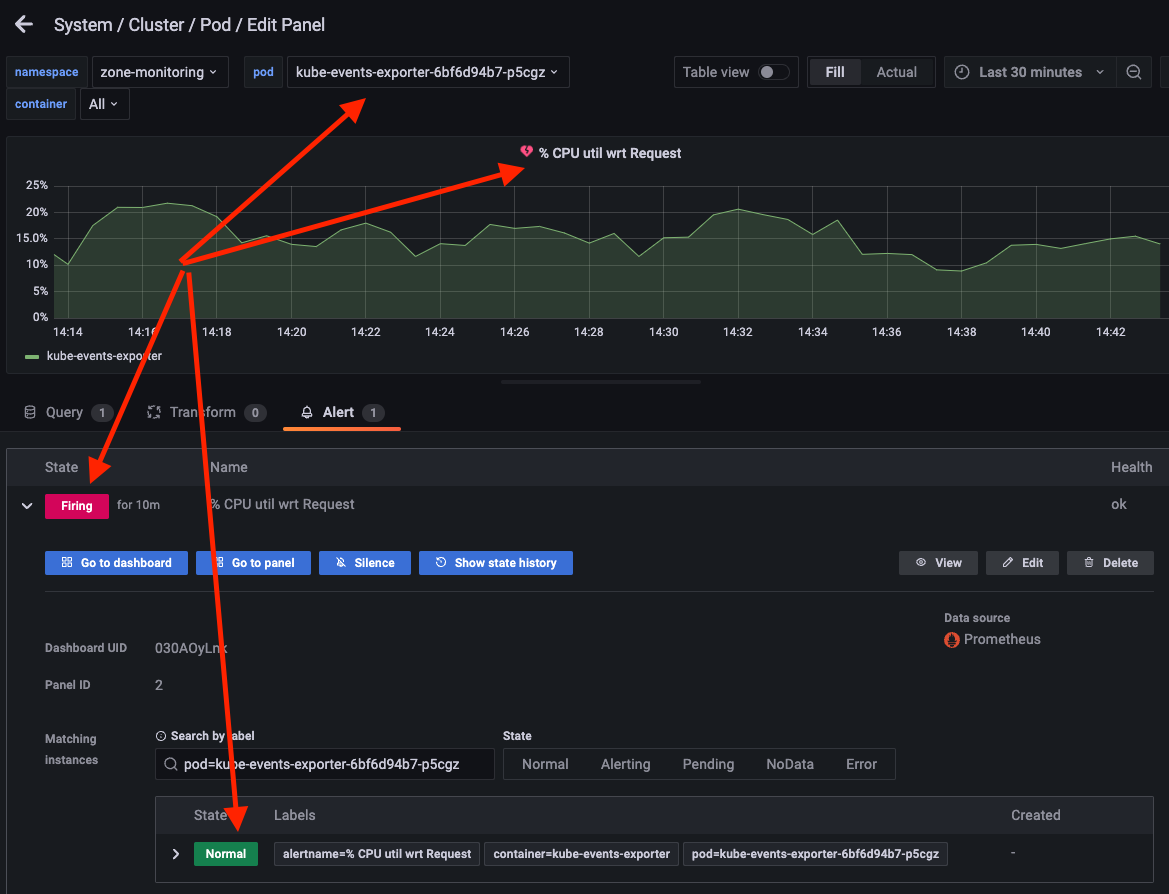
I’ve setup an alert for high cpu per container and linked it to the container dashboard’s cpu panel. It shows broken symbol on the panel if any of the containers is breaching the limit and not necessarily the one that is currently selected.
Is this expected? Is there a way around this?