Hello,
i am using grafana v8.0.5 and as Datasource i use Prometheus.I want to monitor the DB Storage of MSSQL and displaying the result in Pie Chart.I also use a custom MSSQL DB Exporter and for monitoring the storage i use a query which returns this outcome to me:
![]()
I use below metrics :
mssql_db_size_used_total
mssql_db_size_used_storage
What i am looking for,is a Pie Chart like this(Microsoft Azure Portal).Here is shown the Total Size and Used Size in GB and %.

So i tried to get a similar Chart in grafana

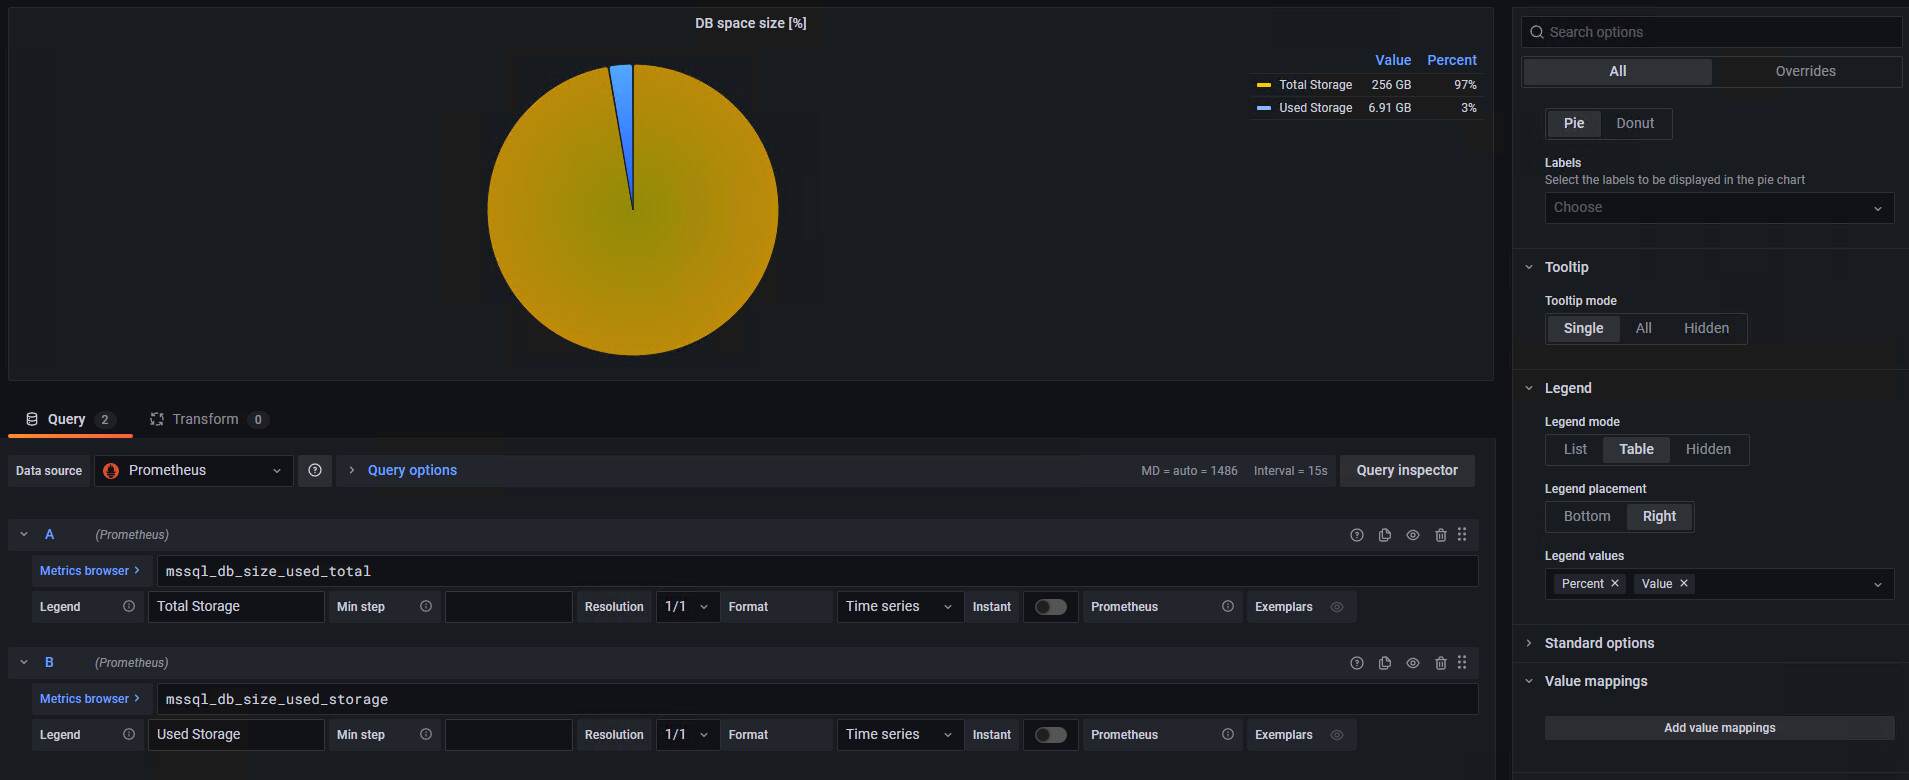
The Value in GB looks fine,but the Percent doesn’t.I don’t understand why the Total percentage is subtracted?I don’t use any arithmetic operation here.
For me it looks like a limitation of grafana.Unfortunately on grafana documentation i did not find any example of Pie Chart using Prometheus as datasource.
Any hint is welcome.