I just started using Grafana + Loki for our centralized logging system, and also to visualize data.
I know there is two query types: Range and Instant.
I have read about this, and but still don’t really understand the difference. Can someone please give simple explanation?
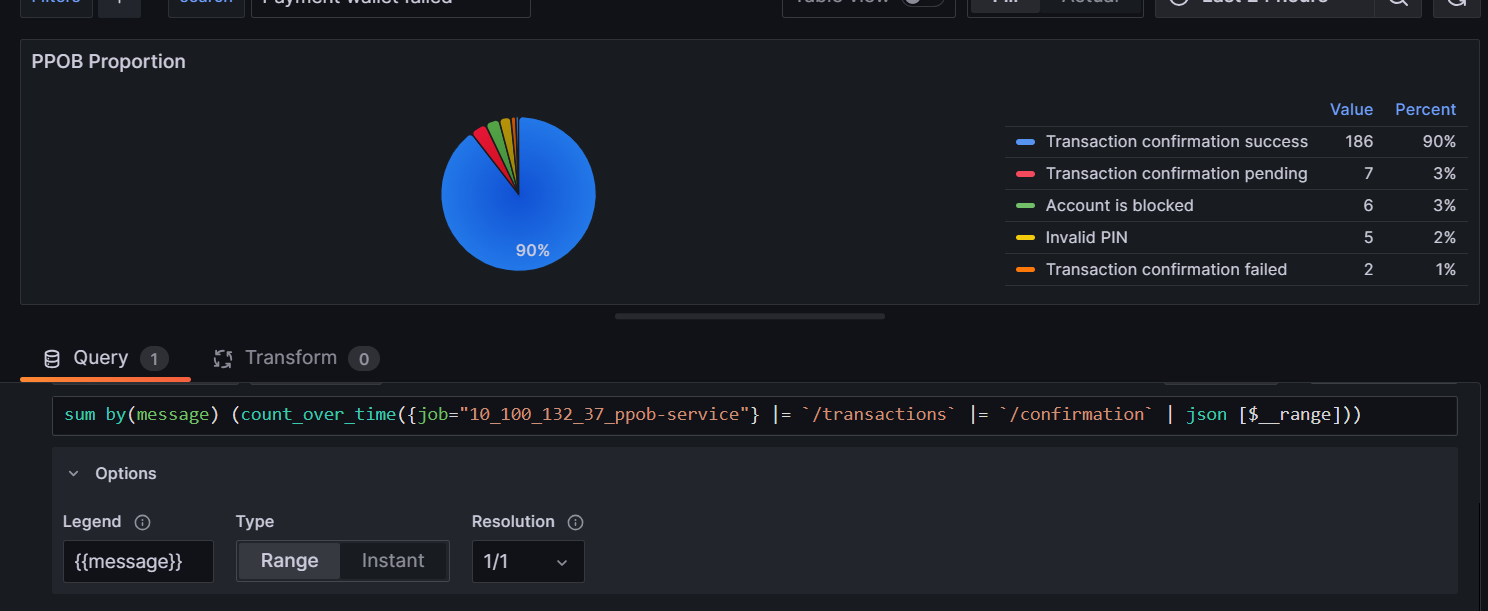
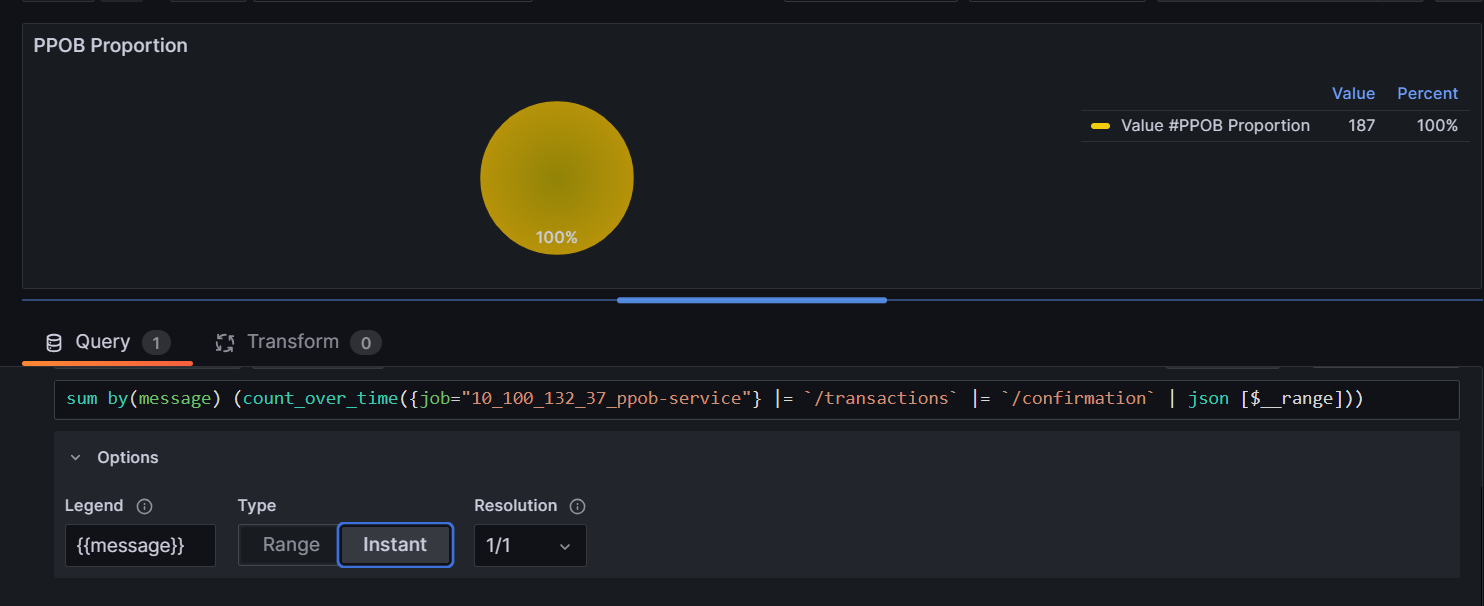
I also found something strange if I want to visualize the data using pie chart with Instant query.
For vector queries, instant query is a set of timeseries data where every data point maps to a single data point at that instant. And you can think of range query like instant query, except that it’s collected multiple times at certain interval during the “range”.
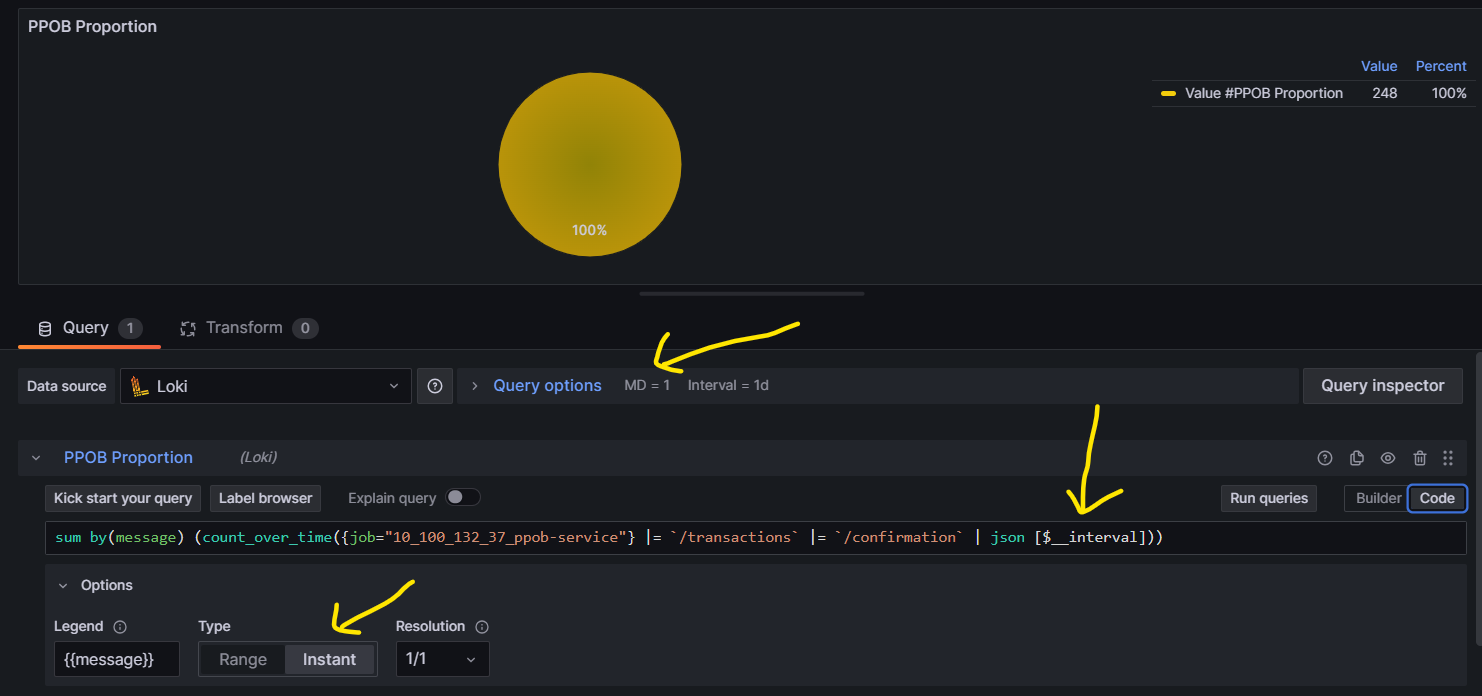
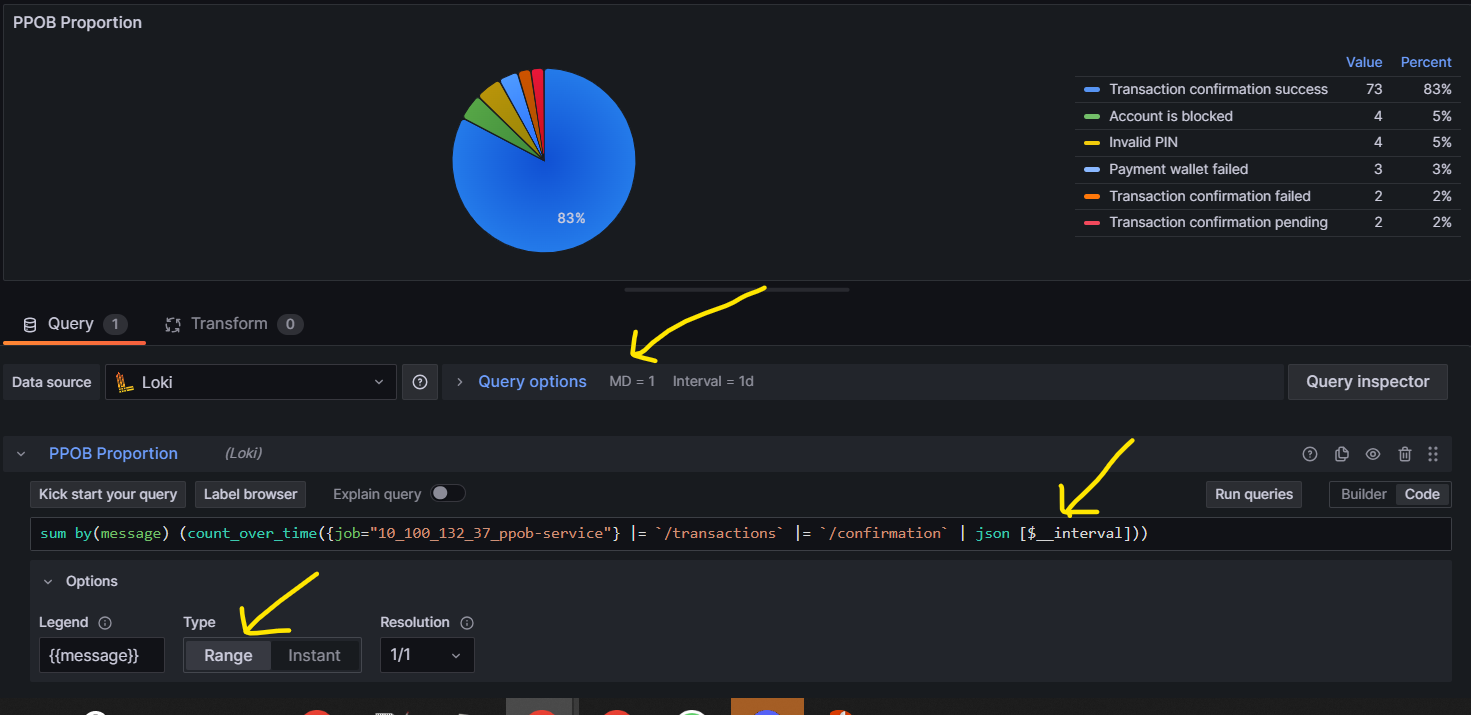
In general, pie chart is more useful with instant query because you want a representation of the data for a specific range at an instant. You have two ways to achieve that, you either use $__range in the query (effectively executing a range query exactly once, which is your first screenshot), or you set the number of data point to 1 and use $__interval in your query (effectively executing an instant query using the full range as interval). Your second screenshot would have worked if you had used $__interval with a max data point of 1.
For time series visualization range query is almost always more useful.
You can also look at query inspector and observe the json return and see the difference there.
How to show the pie chart with correct grouping using query type = Instant?
I know instant query is more useful for pie chart, but somehow the grouping is not working if I use instant query.
As you can see on my first screenshot, the data is being accumulated. This is not the result that I’m expecting. I want to have result as in my second screenshot (in which the data is being grouped correctly), but using instant query.