Jicofo 2021-01-25 14:42:43.511 INFOS: [88] org.jitsi.jicofo.FocusManager.log() Created new focus for fdr@example.example1. Conference count 1,options: channelLastN=-1 enableLipSync=false openSctp=true disableRtx=false
Jicofo 2021-01-25 14:42:36.593 INFOS: [73] org.jitsi.jicofo.FocusManager.log() Created new focus for yut@example.example1. Conference count 1,options: channelLastN=-1 enableLipSync=false openSctp=true disableRtx=false
Jicofo 2021-01-25 14:27:18.412 INFOS: [83] org.jitsi.jicofo.FocusManager.log() Created new focus for abc@example.example1. Conference count 2,options: channelLastN=-1 enableLipSync=false openSctp=true disableRtx=false
Jicofo 2021-01-25 14:27:13.693 INFOS: [81] org.jitsi.jicofo.FocusManager.log() Created new focus for xyz@example.example1. Conference count 1,options: channelLastN=-1 enableLipSync=false openSctp=true disableRtx=false
What I am trying to do is to get the number after the “Conference count” (could me 1 digit or more) and
either :
to show it in a different column or
to show it directly in a dashboard of stats of the last Conference count number
I’m new to the Grafana-Loki-Promtail environment therefore i have searched for quite long time to my problem, I have also read the grafana documentation but i couldn’t understand much
to show these logs i have loki query as follows :
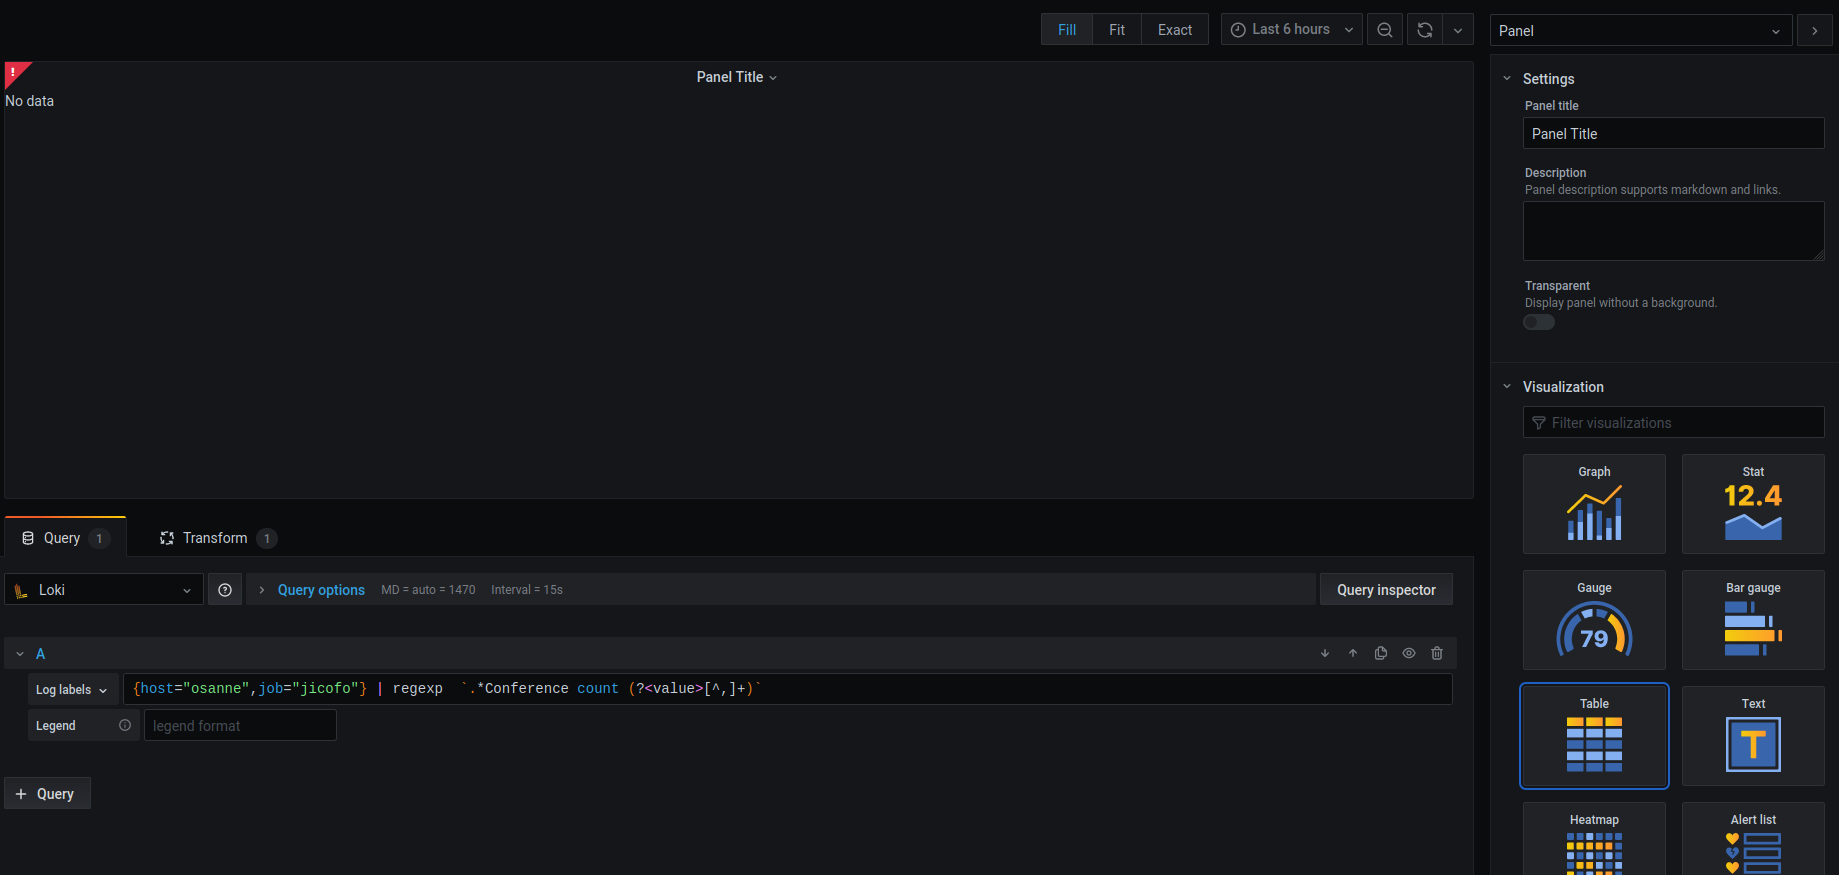
{host="$host",job="$job"} |~“Conference count”
Use | regexp command with a regex to extract the values from your log line and associate them with Labels. If you have control over the source of logs, send them as json or logfmt to save even more time.
Then in Grafana 7 Transforms use the “Labels to Fields” Transform and leave de input blank.
Hope this helps.
If you are trying to do other than just display the raw value, read the Loki Grafana Documentation about LogQL, it has examples on counting, summing, occurences and metrics as well as using *_over_time functions on your data. If you use *_over_time functions you need to cast the log values as metrics using:| unwrap labelname
Cheers.
This should extract a label named value and then as @potatojohn mentioned you can use transforms to hopefully get this into the display format you are looking for!
and the screenshoot below is the part of where i have tryed labels to fields that @potatojohn mentionned but there is no option displayed (probably because the regex doesn’t work)