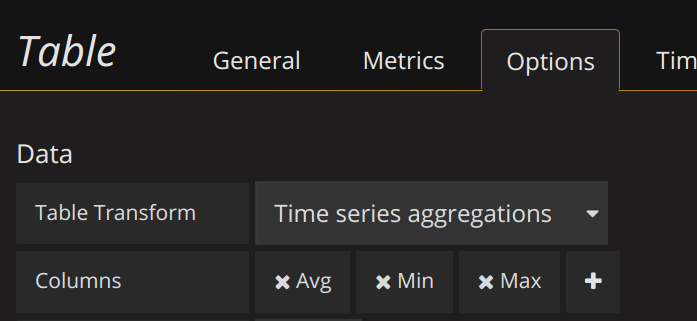
The closest I could get to what you want is to use the Time series aggregations option and then choose the avg, min and max aggregations but that looks like it conflicts with your data. I don’t think the Table Panel is flexible enough to to do what you want.
As a side issue, I think you could make your query simpler by using regex. Something like:
/jmeter.*.ok.(avg|min|max)/