Hello All,
I have a strange behavior that i’m note able to understand.
Context: I have built a graylog server (3) with an obvious ES instance (on a server dedicated).
An other server provides a grafana instance.
In the grafana instance, i have configured an ES connector which seems to work correctly (i maybe wrong).
From the explore menu, i can browse (log sub menu) datas picked up from the ES instance:
first problem: from the metrics option, nothing is available (i think my problem is here…)

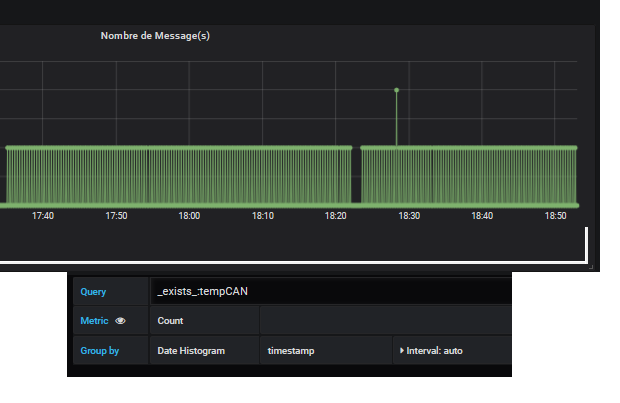
A dashboard with a simple “message counting” is working correctly (simple, basic, it’s my first dashboard ![]() ). the graphics data seems to be correct (the logging slave send one message every 30s for this test)
). the graphics data seems to be correct (the logging slave send one message every 30s for this test)
And as you can expect, I have a little trouble: when i’m trying to add other kind of graphics … nothing works as expected:
the groupby submenu show my ES keys datas
But the metric menu does not allow me to choose my data to graph:

Anyone could have an idea of my error(s)?
Thanks !