Hello!
I’m using Grafana version 9.2.8 with PagerDuty integration. I got basic alerting working but as a next step I wanted to have more control over the summary and title of alerts that Grafana sends out to PagerDuty. I have looked at several documentation about how to use Go templating and Go language in alert summary fields but for me the Go code never is parsed.
Illustration:
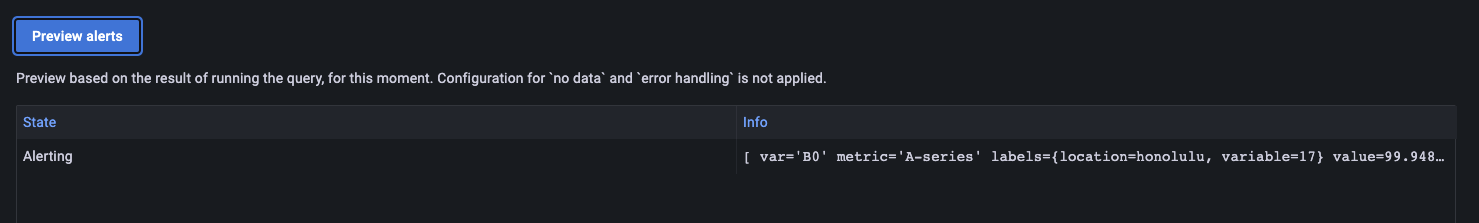
My alert is firing with this variable info:
[ var=‘B0’ metric=‘event_streamer.mean’ labels={} value=35614.5 ]
According to documentation I should be able to access this data in Summary field (the Alert Rule annotation fields) in Alert Rules Edit Page
Event Streamer {{ $values.B.metric }} duration is over 20 seconds: {{ $values.B.value }} ms.
But I get a “no value” text in place of the actual values.
What am I doing wrong?