sauske
August 22, 2023, 2:24pm
1
Hello
I got logs from device2023-08-22 17:17:00 [17:17:00.033746 0.005799] Battery Lifetime: [590] days
was trying to use pattern>|< >|<>|< >|<>|:< >”
Hello,
Try this:
{...} | pattern "<_> <_> <_> <_> <_> <_> <_> [<ITEM>] <_>"
sauske
August 22, 2023, 4:39pm
3
i done it already, but what next ? how i can get ITEM label ?
I miscopied your log with an extra space at the beginning. Delete one <_> before the [<ITEM>], like this:
{...} | pattern "<_> <_> <_> <_> <_> <_> [<ITEM>] <_>"
Now you should do something to aggregate that, for example:
count by (ITEM) ({...} | pattern "<_> <_> <_> <_> <_> <_> [<ITEM>] <_>")
sauske
August 22, 2023, 5:10pm
5
got feeling that it still didn’t take values of 590 and just take 1 from logs count at data point (each dot on graph is taken from logs that arrives each 10 min)
Oh you want to extract and display the values.
Here is what I did:
# This pattern is for my logs file, keep using the pattern you tried earlier.
{logs="dags"} |= `` | pattern `<_> <_> {<_>:<ITEM>} <_>` | ITEM =~ `.+`
It returned this:
And then, in the Transform section, I extracted the ITEM value and convert it to Number data type:
After that I chose a timeseries type of visualization and it resulted like this (the only logs I have are generated every second and they have only one numeric and unique value):
sauske
August 22, 2023, 6:02pm
7
clevernessisamyth:
| ITEM =~ .+``
it returns No volume data. perhaps it’s because my log comes as text line (it have only 2 fields filename and job) and in you example json
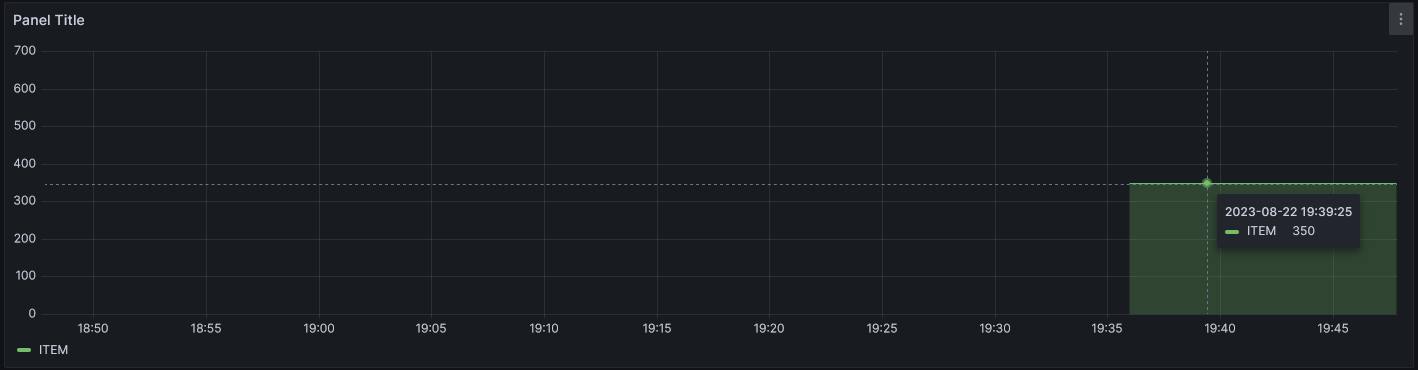
Try to run the query in a Dashboard/Panel and not in the Explore.
In the Explore:
In a panel:
sauske
August 22, 2023, 6:17pm
9
clevernessisamyth:
| ITEM =~ .+``
it didn’t help .+ it shows no data
Yeah you used the pattern for my own logs, use this one:
{...} | pattern "<_> <_> <_> <_> [<ITEM>] <_>"
Sorry for the inconvenience
sauske
August 22, 2023, 6:26pm
11
when i use my pattern situation the same, it didn;t work
according to tool i shoud have new label ITEM but i don’t have it
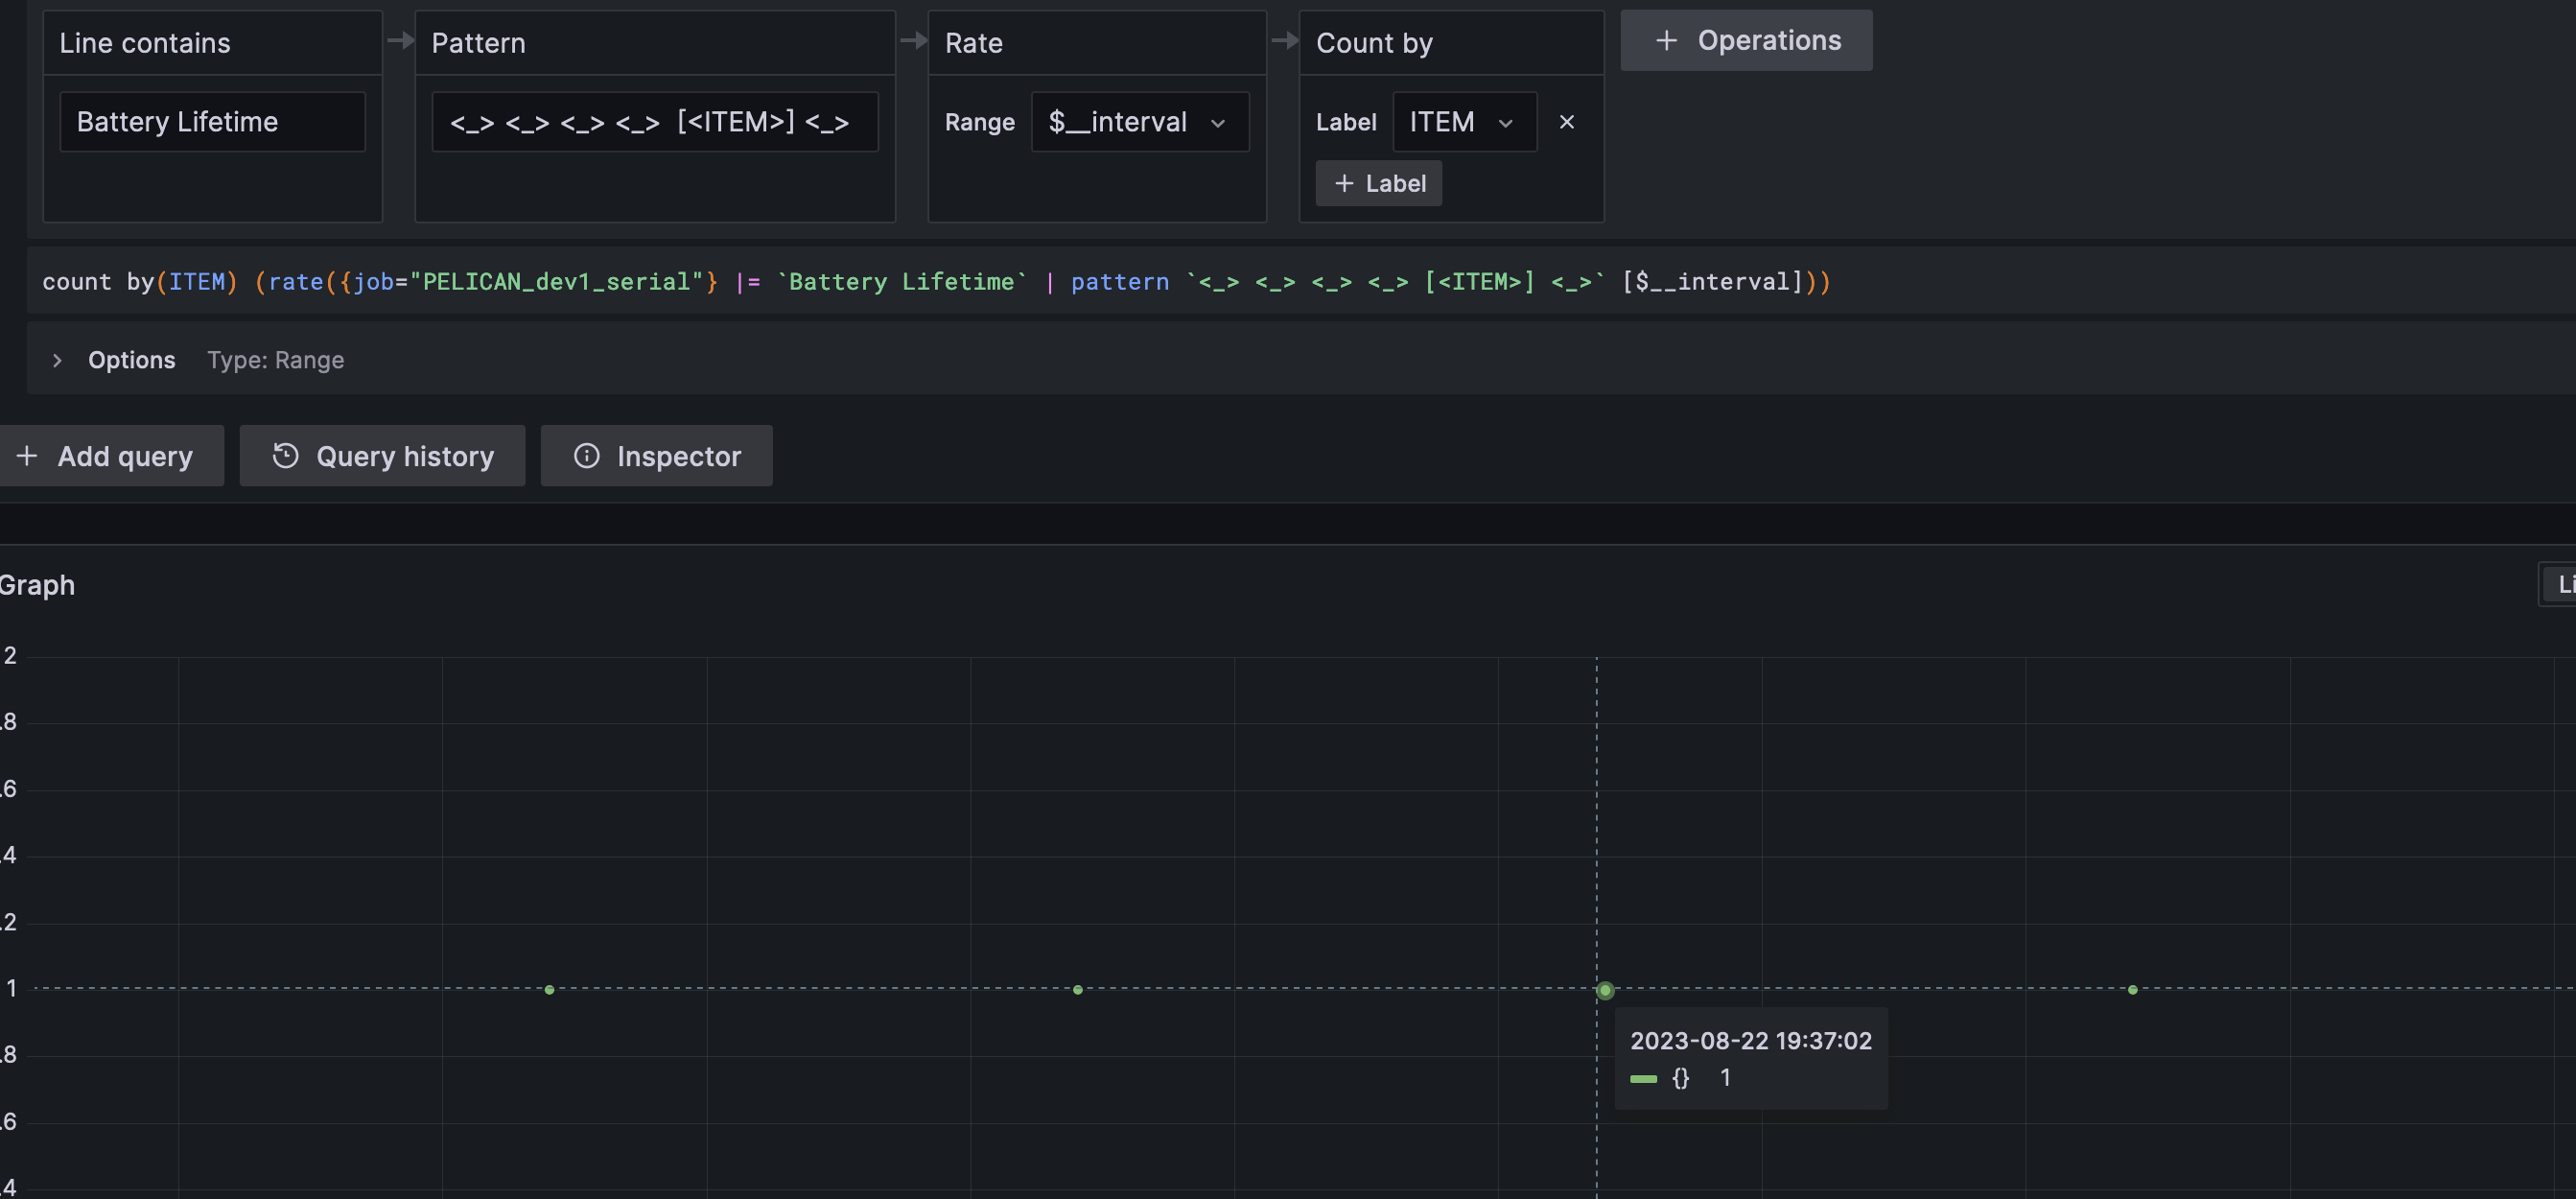
Yes because you included 2023-08-22 17:17:00 which is not in the log files as you can see here in the column “Line”:
Now, in order to get the value 590, this should work:
{...} | pattern "<_> <_> <_> <_> [<ITEM>] <_>"
You posted this earlier, you’ve got the pattern right:
Now, omit the other stuff:
{job="PELICAN_dev1_serial"} |= `Battery Lifetime` | pattern "<_> <_> <_> <_> [<ITEM>] <_>" | ITEM ~= `.+`
sauske
August 22, 2023, 6:46pm
13
still not working but now i think i know why
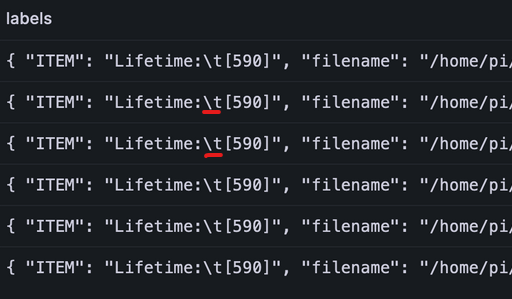
it shows Label and seems that in log line some hidden symbols like \t and pattern return not 590, it returns other value
I think you didn’t see my previous reply.
Try this, it should work now
{job="PELICAN_dev1_serial"} |= `Battery Lifetime` | pattern "<_> <_> <_> <_> [<ITEM>] <_>" | ITEM ~= `.+`
sauske
August 22, 2023, 6:54pm
15
unfortunately it shows No data
clevernessisamyth:
| ITEM ~= .+``
remove this and show me the table
| ITEM ~= `.+`
Oh I just saw your previous picture. There is a tab between Lifetime: and [590].
Try this:
{job="PELICAN_dev1_serial"} |= `Battery Lifetime` | pattern "<_> <_> <_> <_>\t[<ITEM>] <_>" | ITEM ~= `.+`
If it doesn’t work, look for what separates all the values in your logs.
sauske
August 22, 2023, 7:12pm
19
It works as i need !
Thank you a lot for help !