Echarts Les Miserables panel blank

  • What are you trying to achieve?
    Map netflow traffic with eCharts plugin Les Miserables

  • How are you trying to achieve it?
    Map Elastic query results to proper format for

  • What happened?
    Using console.log I believe the query results are mapping to the correct format but the panel is completely blank.

  • What did you expect to happen?
    Results would render as a circular graph of nodes(circle shape points) and connnections(string like links).

  • Can you copy/paste the configuration(s) that you are having problems with?

Hi Grafana Community!

Goal is to build this chart:
image

console.log(“graph”, graph) returns “graph” array containing 3 arrays “nodes”, “links” and “categories”:
image
Expanded console.log(“graph”, graph) results:
image
Results:

Have watched/read all support materials from Volkov labs but I’m not finding any answers yet. Any thoughts or suggestions?

Thanks,
Christine

@christinevonschrott1 Do you see any errors in the Browser Console?

Oddly no, not seeing any errors in console. Just refreshed the query to get new console results. It just seems to log the mapped data.

I’m doing a series mapping from 2 Elastic queries (“nodes” and “links”) using “ref id” and then adding the results of each array to the “graph” object. Would you recommend a different approach?

Here’s the full code:

let nodes;
data.series.map((s) => {
if (s.refId === ‘nodes’) {
var title = s.fields.find((f) => f.name === ‘sIp’).values.buffer;
var symbolSize = s.fields.find((f) => f.name === ‘bytes’).values.buffer;
var category = s.fields.find((f) => f.name === “Count”).values.buffer;

nodes = title.map((title, i) => {
  return { "name": title,
              "symbolSize": symbolSize[i],
              "category": category[i] };
})

}
});

let links;
data.series.map((s) => {
if (s.refId === “links”) {
var sources = s.fields.find((f) => f.name === “sIp”).values.buffer;
var targets = s.fields.find((f) => f.name === “dIp”).values.buffer;

links = sources.map((sources, i) => {
  return { "source": sources, 
               "target": targets[i] }
});

}
});

const categories = [
{ “name”: “1” }, { “name”: “2” }, { “name”: “3” }, { “name”: “4” }, { “name”: “5” }, { “name”: “6” }, { “name”: “7” }, { “name”: “8” }, { “name”: “9” }]

let graph = {};
graph[“nodes”] = nodes;
graph[“links”] = links;
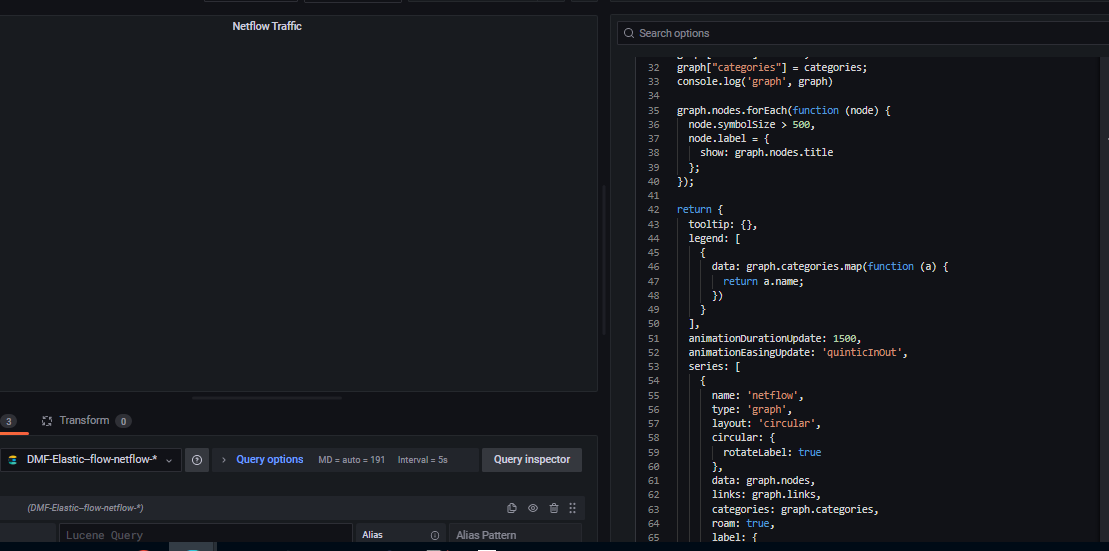
graph[“categories”] = categories;

//console.log(‘graph’, graph)

graph.nodes.forEach(function (node) {
node.symbolSize > 500,
node.label = {
show: graph.nodes.title
};
});

return {
tooltip: {},
legend: [
{
data: graph.categories.map(function (a) {
return a.name;
})
}
],
animationDurationUpdate: 1500,
animationEasingUpdate: ‘quinticInOut’,
series: [
{
name: ‘netflow’,
type: ‘graph’,
layout: ‘circular’,
circular: {
rotateLabel: true
},
data: graph.nodes,
links: graph.links,
categories: graph.categories,
roam: true,
label: {
position: ‘right’,
formatter: ‘{b}’
},
lineStyle: {
color: ‘source’,
curveness: 0.3
}
}
]
};

This is the minimal working code for the Les Miserables. I am checking your code now.

const nodes = [
  {
    "id": "0",
    "name": "Myriel",
    "symbolSize": 19.12381,
    "value": 28.685715,
    "category": 0
  },
  {
    "id": "1",
    "name": "Napoleon",
    "symbolSize": 2.6666666666666665,
    "value": 4,
    "category": 0
  },
  {
    "id": "2",
    "name": "MlleBaptistine",
    "symbolSize": 6.323809333333333,
    "value": 9.485714,
    "category": 1
  },
];

const links= [
    {
      "source": "1",
      "target": "0"
    },
    {
      "source": "2",
      "target": "0"
    },
    {
      "source": "2",
      "target": "1"
    },
]

const categories= [
    {
      "name": "A"
    },
    {
      "name": "B"
    },
  ]

nodes.forEach((node) => {
  node.label = {
    show: node.symbolSize > 30
  };
});

return {
  tooltip: {},
  legend: [
    {
      data: categories.map((a) => a.name)
    }
  ],
  animationDurationUpdate: 1500,
  animationEasingUpdate: 'quinticInOut',
  series: [
    {
      name: 'Les Miserables',
      type: 'graph',
      layout: 'circular',
      circular: {
        rotateLabel: true
      },
      data: nodes,
      links: links,
      categories: categories,
      roam: true,
      label: {
        position: 'right',
        formatter: '{b}'
      },
      lineStyle: {
        color: 'source',
        curveness: 0.3
      }
    }
  ]
};

@christinevonschrott1 Here is the working code to read data from the data source

let nodes, links;
/**
 * Data Source data
 */
data.series.map((s) => {
  if (s.refId === 'nodes') {
    var titles = s.fields.find((f) => f.name === 'sIp').values.buffer;
    var symbolSizes = s.fields.find((f) => f.name === 'bytes').values.buffer;
    var categories = s.fields.find((f) => f.name === 'Count').values.buffer;

    nodes = titles.map((title, i) => ({
      "name": title,
      "symbolSize": symbolSizes[i],
      "value": symbolSizes[i],
      "category": categories[i],
      label: {
        "show": symbolSizes[i] > 1
      }
    }))
  }

  if (s.refId === 'links') {
    var sources = s.fields.find((f) => f.name === 'sIp').values.buffer;
    var targets = s.fields.find((f) => f.name === 'dIp').values.buffer;

    links = sources.map((source, i) => (
      {
        "source": source,
        "target": targets[i]
      }
    ))
  }
});

/**
 * Categories
 */
const categories = [
  { 'name': '1' }, { 'name': '2' }, { 'name': '3' }
]

return {
  tooltip: {},
  legend: [
    {
      data: categories.map((a) => a.name)
    }
  ],
  animationDurationUpdate: 1500,
  animationEasingUpdate: 'quinticInOut',
  series: [
    {
      name: 'Net flow',
      type: 'graph',
      layout: 'circular',
      circular: {
        rotateLabel: true
      },
      data: nodes,
      links: links,
      categories: categories,
      roam: true,
      label: {
        position: 'right',
        formatter: '{b}'
      },
      lineStyle: {
        color: 'source',
        curveness: 0.3
      }
    }
  ]
};

This example was added in Documentation: Data Sources | Volkov Labs