Hello Grafana Community,
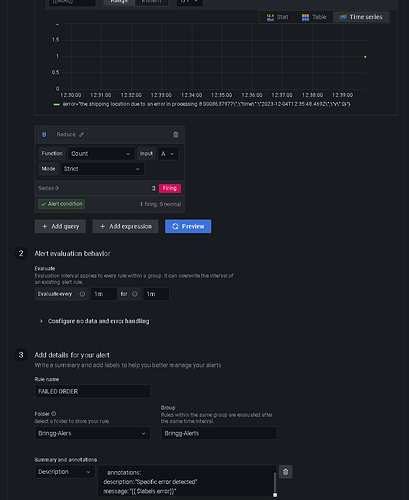
I am encountering an issue with Grafana alerting where I cannot seem to extract a label from my query in the alert rule definition. Despite the query results visibly containing the label values, the alert message shows “” for the label placeholder.
I’ve attached a screenshot for reference. The query is set up correctly and returns data, but when setting up the alert, the label does not get passed to the alert message as expected. Here is the configuration snippet:
annotations:
  description: "Specific error detected"
  message: "{{ $labels.error }}"
Evaluation interval and condition are set as per usual, but the {{ $labels.error }} template variable does not get replaced with the actual error label from the query result.
Has anyone experienced a similar issue or can provide insight into what might be going wrong? Any suggestions for troubleshooting this behavior would be greatly appreciated.
Thank you for your assistance!

