Different results for the same query

Hello, I have Grafana Tempo in a single binary installation. There are 2 replicas of tempo binary.
And the problem is that I got completely different results when I execute the same search query (by traceid) a couple of times. I tried to put query frontend in front of querier but got the same
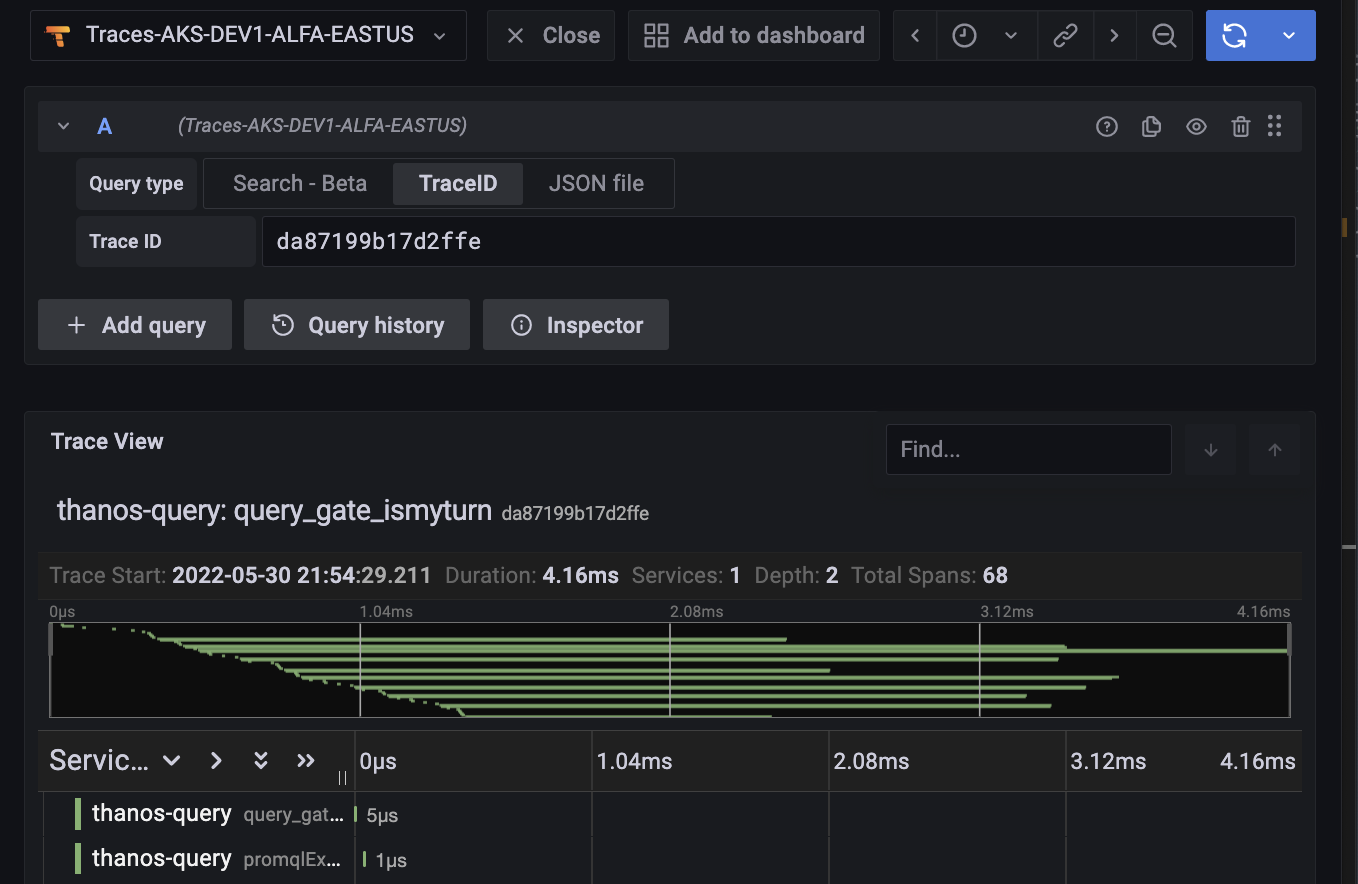
here is result #1:


and below is the completely different result for the same query:

The single binary deployment is generally intended as an easy to operate, but not-scalable solution. There are ways to get the single binary be horizontally scalable, but it won’t work that way by default:

Also, note that for any of the scalable solutions to work you will need to use an object storage backend. Local disk will not work.

I’ve switched to simple-scalable, but still have this issue. And sometimes it even says 404 Not found for the traceid and provides the information on the next query run:


This is difficult to diagnose from here. There are multiple situations that could result in the behavior you’re seeing. Can you provide:

  • config
  • any logs of error level
  • information about your deployment? how many shards do you have?
  • more information about the pictured trace.
    • was their a delay from tempo receiving the trace to when it returned it successfully?
    • after tempo returned the trace successfully once does it always return it? or does it intermittently 404 and successfully return?
    • any other details about the behavior

Hello @joeelliott .
There are 2 Tempo PODs in the Kubernetes cluster. Also, there are 2 Query Frontend PODs in front of the Tempo. Tempo PODs configured with -target=scalable-single-binary argument.
I’ve tried configuration without QueryFrontend (ingress->K8service->PODs) but got the same result.
Tempo reads data directly from the Kafka topic.
Here is a configuration

    multitenancy_enabled: false
    search_enabled: true
    compactor:
      compaction:
        compacted_block_retention: 168h
    distributor:
      receivers:
        kafka:
          auth:
            tls:
              ca_file: /tmp/ca.crt
              insecure: true
          brokers: kafka-cluster-kafka-bootstrap.kafka.svc.cluster.local:9093
          client_id: tempo-ingester
          encoding: otlp_proto
          group_id: tempo-ingester
          message_marking:
            after: true
            on_error: true
          protocol_version: 2.8.0
          topic: otlp-tracing
    ingester:
      {}
    server:
      http_listen_port: 3100
    storage:
      trace:
        azure:
          container-name: tempo
          storage-account-key: xxxkeyxx
          storage-account-name: azurestorageaccount
        backend: azure
        cache: memcached
        memcached:
          addresses: dns+memcached:11211
        wal:
          encoding: snappy
          path: /var/tempo/wal
    querier:
        frontend_worker:
            frontend_address: grafana-tempo-query-frontend-discovery:9095
            parallelism: 10
        max_concurrent_queries: 10
    query_frontend:
        query_shards: 30
        search:
            concurrent_jobs: 300
            max_duration: 2h0m0s

Regarding system behavior, it can return 404 or the successful result without any pattern. So you can get a couple 404 in raw and then a successful and then 404 again. To me, it looks like related to which Tempo POD is serving my query. Another case is on the first screenshots: when the same query for the same traceid returns completely different results. Again, looks like the whole trace was divided into two parts, And the query returns only the part which is present on Tempo POD that is servicing the query request. What is interesting, is that over time, it starts to return the correct value (of full, joined trace) all the time. When I’ve decreased the number of Tempo PODs to 1 replica everything works correctly.
We have traces from the Nginx ingress controller, Thanos query, and other systems, and the behavior is the same for all of them.
And there are no errors in the log

For Tempo to work when it’s deployed in a scalable fashion (either as scalable single binaries or as microservices) the components have to be aware of each other.

Right now your queriers are only querying the local ingester b/c that’s the only ingester they know exists. This is why the trace returning is conditionally based on which querier pulled the job. If you waited long enough for that trace to be flushed to your azure backend then i would expect it to return everytime instead of 404ing about half the time.

In order for Tempo components to know that the others exist they rely on propagating a data structure called the ring. There are a few of these and each one coordinates a different set of components:

The easiest and most battle tested way to propagate the ring(s) is to use memberlist. This is a gossip protocol and requires no additional components to be deployed. The memberlist configuration requires a list of IPs or a DNS address that resolves to a set of IPs. Example here:

This docker compose example simply lists DNS names for the 3 different shards. If you had a single DNS entry that resolved to all 3 IPs that would work too.

Hopefully this will resolve your issue. If not, let me know!

Thank you very much @joeelliott

1 Like

hello @joeelliott
I have the same issue again and can’t understand where to look at.
But this time I have Tempo in distributed mode.
here is a full config:

    compactor:
      compaction:
        block_retention: 168h
      ring:
        kvstore:
          store: memberlist
    distributor:
      receivers:
        kafka:
          auth:
            tls:
              ca_file: /tmp/ca.crt
              insecure: true
          brokers: kafka-cluster-kafka-bootstrap.kafka.svc.cluster.local:9093
          client_id: tempo-ingester
          encoding: otlp_proto
          group_id: tempo-ingester
          message_marking:
            after: true
            on_error: true
          protocol_version: 2.8.0
          topic: otlp-tracing
      ring:
        kvstore:
          store: memberlist
    ingester:
      lifecycler:
        ring:
          kvstore:
            store: memberlist
          replication_factor: 3
        tokens_file_path: /var/tempo/tokens.json
    memberlist:
      abort_if_cluster_join_fails: false
      join_members:
      - grafana-tempo-tempo-distributed-gossip-ring
    metrics_generator_enabled: false
    multitenancy_enabled: false
    overrides:
      per_tenant_override_config: /conf/overrides.yaml
    querier:
      frontend_worker:
        frontend_address: grafana-tempo-tempo-distributed-query-frontend-discovery:9095
    query_frontend:
      query_shards: 30
      search:
        concurrent_jobs: 300
        max_duration: 72h0m0s
        query_backend_after: 15m0s
        query_ingesters_until: 1h0m0s
    search_enabled: true
    server:
      grpc_server_max_recv_msg_size: 4194304
      grpc_server_max_send_msg_size: 4194304
      http_listen_port: 3100
      log_format: json
      log_level: info
    storage:
      trace:
        azure:
          container-name: tempo
          hedge-requests-at: 500ms
          hedge-requests-up-to: 2
          storage-account-key: gWyUSBYvYhrcCXLB9nmLducMpeZ2TURLP6oqW8UzYW4U4KjHmDKW35ivYjiwp8zwjxnZU+ItnRv0+AStvnM5/A==
          storage-account-name: monitoring3dtjuup1ejjx76
        backend: azure
        blocklist_poll: 5m
        cache: memcached
        local:
          path: /var/tempo/traces
        memcached:
          addresses: dnssrv+_memcache._tcp.memcached
          consistent_hash: true
          host: ""
          service: dns+memcached:11211
          timeout: 500ms
        wal:
          path: /var/tempo/wal

and here is the result of executing 2 requests:


Both requests were executed almost in the same time

Could you please advise what might be the reason for such behavior?

looks like all good. it was my browser cache

This topic was automatically closed 365 days after the last reply. New replies are no longer allowed.