-
What Grafana version and what operating system are you using?
Grafana v12.1.0 (ccd7b6ce7e)
-
What are you trying to achieve?
Human friendly label names in panel under the gauge
-
How are you trying to achieve it?
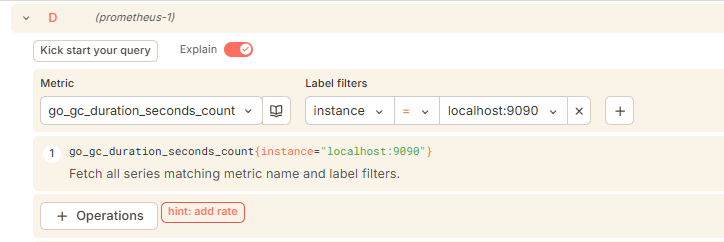
Using dashboard variable
-
What happened?
Label values still non-human friendly
-
What did you expect to happen?
Label under the gauges with human friendly names
-
Can you copy/paste the configuration(s) that you are having problems with?
-
Did you receive any errors in the Grafana UI or in related logs? If so, please tell us exactly what they were.
No errors
-
Did you follow any online instructions? If so, what is the URL?
No similar issue found
I have a Grafana panel that display server states (shown above).
I need to give the servers human recognizable names like: “London”, “Paris”, “Milan”, “Berlin”, “Frankfurt” etc. (for example)
The panel definition is on screenshot (above).
This is the scrape example:
channel_sign_gauge{id="0001"} 0
channel_sign_gauge{id="0777"} 0
channel_sign_gauge{id="1000"} 1
channel_sign_gauge{id="2000"} 1
channel_sign_gauge{id="3000"} 0
channel_sign_gauge{id="4200"} 1
channel_sign_gauge{id="5200"} 1
I have defined dashboard variable “server_location” (screenshot above) but can’t bind a server names variable to their indexes on the panel.
I can achieve this behavior for a single server but can’t do it for all servers at the same time.
Hello @alexyack ,
You can resolve this issue by using Value Mapping and the Field Override method in Grafana. Please follow the steps below:
Step 1. Start the Prometheus Windows Exporter.
Step 2. Integrate the Prometheus data source with Grafana.
Step 3. Define the dashboard variable.
Step 4. Implement one of the following methods to handle the display values:
A: Value Mapping
Option B: Field Overrides
Final output :-
Note: Please ignore the gauge value shown in the output; it appears due to system-level data.
@infofcc3 your recommendation, while good, does not scale. Reason: what if tomorrow they ingest 100 more locations? I can’t imagine them adding 100 entries manually. Hence the solution has to be dynamic.
@alexyack
what does the Victoria metrics query with variable for one single server look like? you might need something like ~= instead of ==
please share query that uses that variable
@infofcc3 thanks for your reply!
Solution A is not acceptable - the “ugly” numbers is the scrape label part, not the metric value.
Solution B is acceptable as a workaround, but @yosiasz is right - we are planing to grew up monitoring server capability
in that case you might also want to reconsider your location variable which is manually carved. you might want to stuff that somewhere in victoria metrics or some other db.
Yes, it is right. But extending list of “key : value” pairs more easy for all staff (including me) that to do overrides.
PS Overrides work fine!
Thanks for idea to @infofcc3 !
In Grafana panel the query code is simple metric name
channel_sign_gauge
See second screenshot in question.
I have copied override rules to another panel and it works fine.