Hello,
I have been using Grafana on a Raspberry PI4 for a few years. Now I have moved my iobroker + grafana + influxDB2 to another Raspberry PI4. I installed the latest OS (bookworm) from the PI. I installed the latest version of grafana. So far so good.
But on my iPad Air 2 (a bit older) I can no longer see the dashboard.
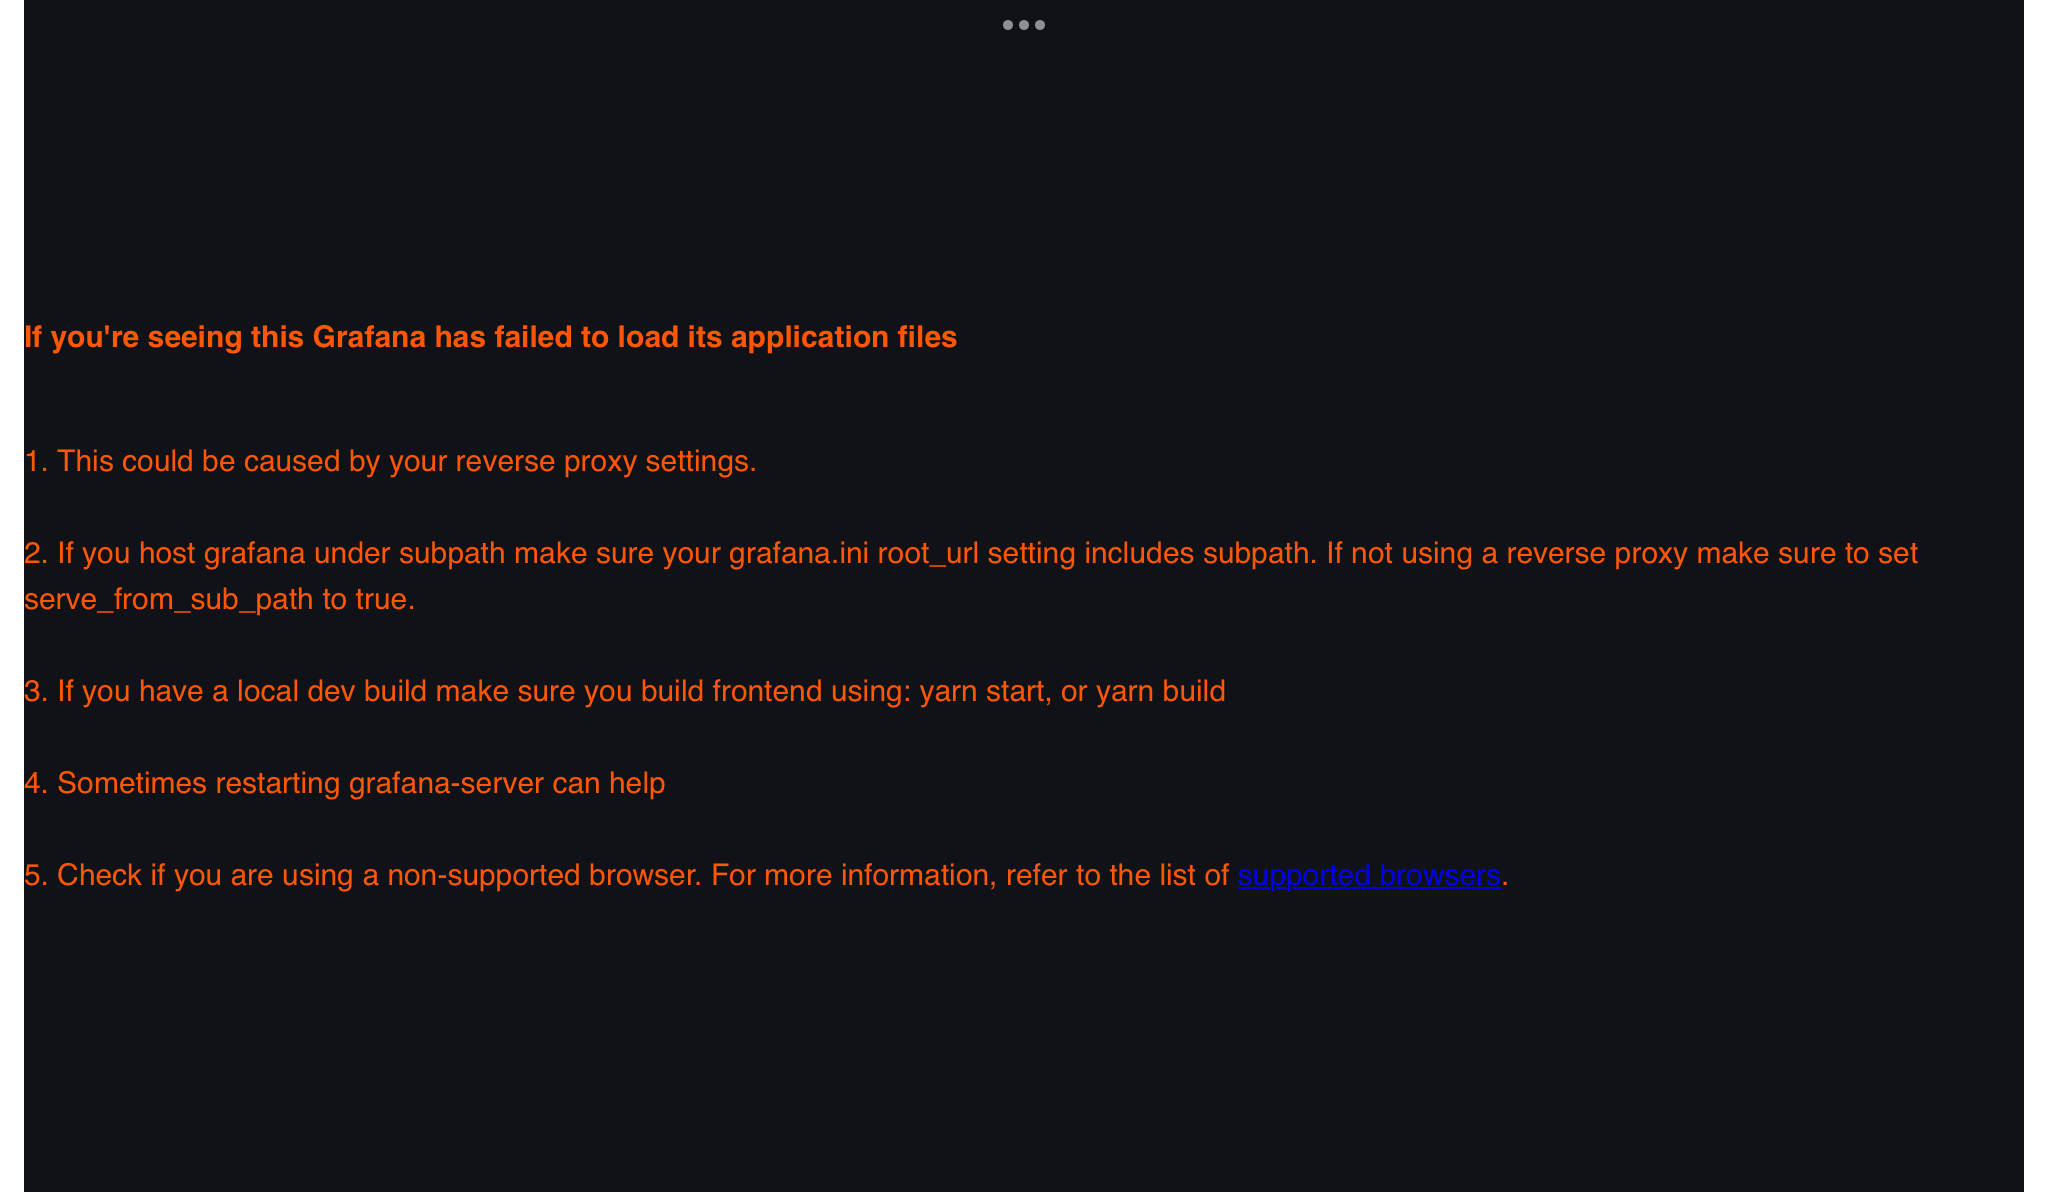
The following is displayed: “If you’re seeing this Grafana has failed to load its application files”
Before my update I was using version V9.
I use Safari and have also tried Chrome. Unfortunately the same result. So I think I have to configure something else in Grafana. Unfortunately I don’t know what the problem is.
What can I do now to see the dashboards?
Can someone help me?
Regards
Andreas