Hi all,
I have been playing around with grafana for quite some time, but this is my first post here, apologies if I forget to mention certain things. My gas energy meter reading is stored in an influxdb database on a regular basis, and in grafana, I am trying to plot the daily consumption as a function of time. Here is how far I got:

What bugs me is that the daily consumption is shown on midnight the following day (0:00 AM) which in principle is correct, but confusing because it is the consumption of the day before. Is it possible to have the bar appear 12h earlier and to also have the tooltip show the corresponding time 12 h earlier?
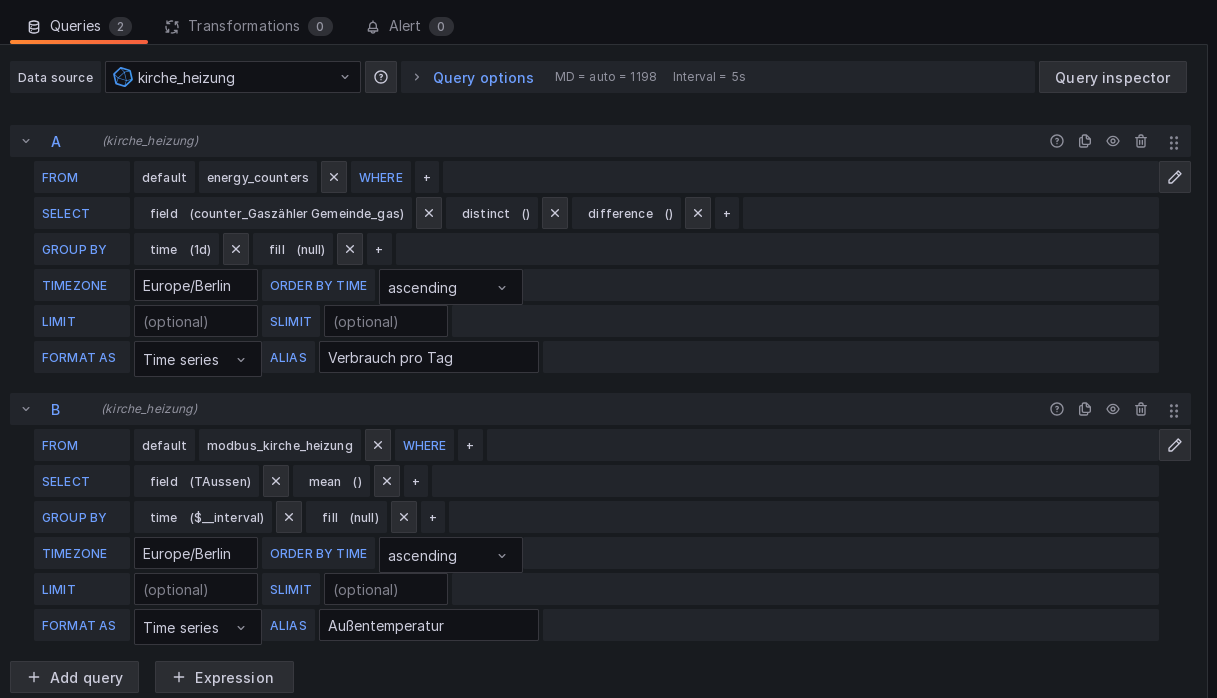
Also, I am trying to correlate this with the temperature and would like to have the average temperature of each day shown, ideally also centered as a bar at noon of the corresponding day. Here is the query for the above:
Any help would be appreciated… Thanks,
Christian