I have data from prometheus which contains the count of files and the timestamp. I want to plot the count of files against the timestamp I’m providing. I’m attaching the screenshot of my query and transformation here.

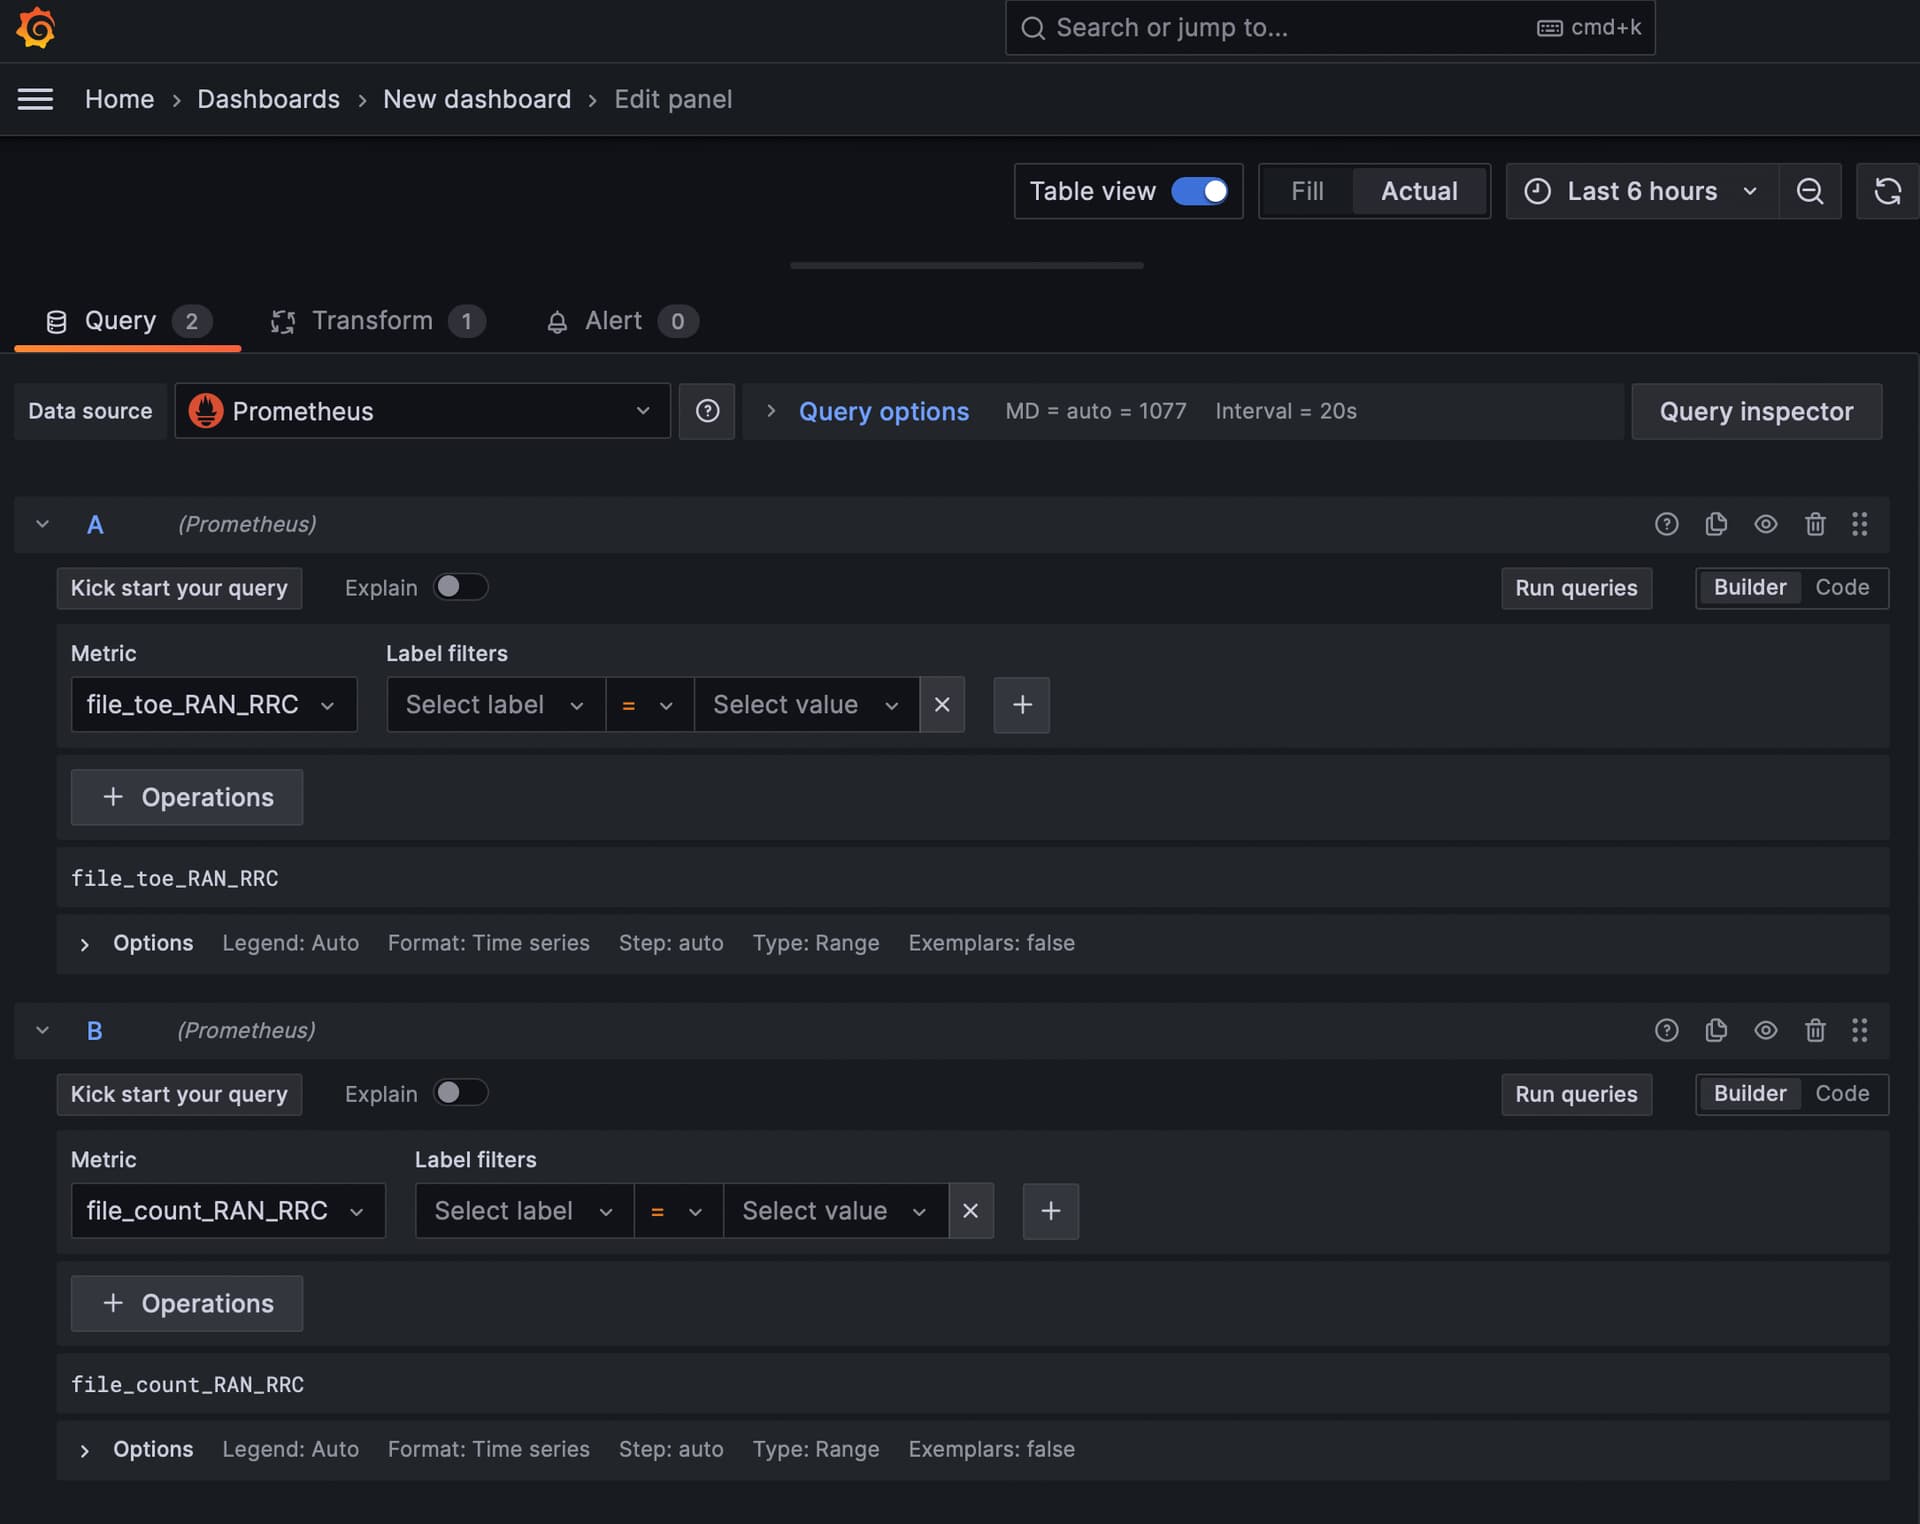
How can I achieves this for line chart?