Hi Guys
I’m new on Grafana.
I’ve created a dashboard to monitor the CPU-Utilization of an EC2 instance using CloudWatch as a data source.
The Alert Rule only moves from “Pending” to “Alerting”(sends an alert to outlook), then moves to “OK”, this only happens once. I need to get these alerts on a daily basis whenever CPU-Utilization reaches a maximum(90%). How can I configure my query or alert rule to achieve this?
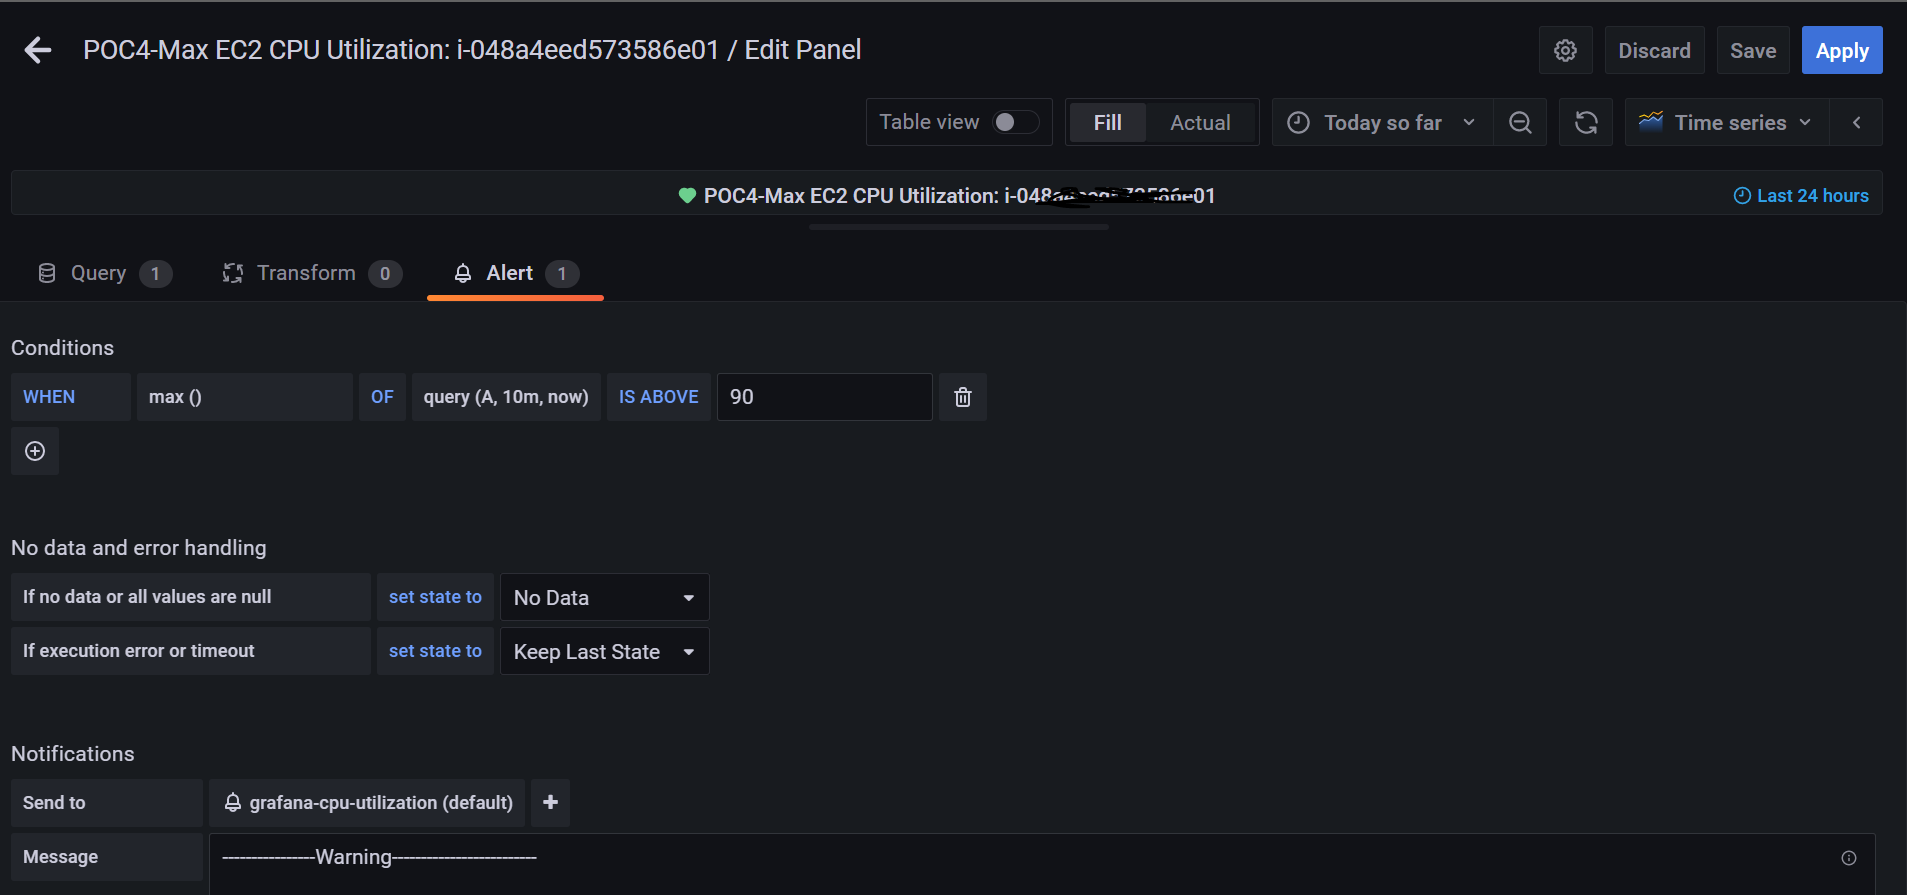
I’ve also attached a picture of the query I’ve created together with the alert rule.