Grafana 10.3.3
Data-source Zabbix
I have a stat panel that displays multiple string values of either “Ended OK ”, “Ended Not OK ” or “Executing ”.
From the main query, I need to count how many are of each value and display this in another panel.
Something like10 Ended OK3 Ended Not OK2 Executing
I thought about including some transformations to count these values, but they don’t seem to fit.
Any suggestion?
starting with some dummy data:
and then two transformations:
1 Like
Hey. Thanks.
I tried to use these transformations, but the thing is that each value shown is a field.
grant2
February 23, 2024, 10:43am
4
Hi @markfree
Can you write a Zabbix query to do counting? I think the solution proposed by @sowdenraymond is perfect given what you initially described, but obviously the actual query behind your stat panel has more info that we were initially led to believe. Can you share the full query here?
Unfortunately, I don’t think the query is customizable to count values.
The query is very simple, actually.
It results in multiple data sets that are filtered and used in different panels.
can you show a table view of your data please?
Yes.
In the table view, I can toggle the data in the selection box below.
can you try the concat transform to put all the data into one table?
When I add the “Concatenate fields” transformation, the panel shows different values, and not the last one.
It separates the fields as columns.
Best option: on Zabbix side (if it’s 5.4 or newer) creating some “Aggregate calculations ” would be easier.
If you need to make it work on Grafana’s side, try to play around with this set of transformations on a table view:
Reduce
“Mode” using “Series to rows”
“Calculations” using “Last *”
Enable “Labels to Fields”
Group by
“Field” using “Calculate (Count)”
“item” using “Group by”
“Last *” using “Group by”
(If you want to rename the columns, just use append an “Organize fields by name” at the end)
Here I got the count of Zeros and Twos in an item:
With renaming:
If you need to make it pretty, just play with some Overrides.
1 Like
Hey Isaque. Thanks for your help.
Unfortunately, Zabbix does not support aggregations for these items because they are string values, not numbers.
All of this looks to me like a frequency distribution and the status values are the actual classes.
When I add the Reduce transformation, this is what I get:
Panel with reduce:
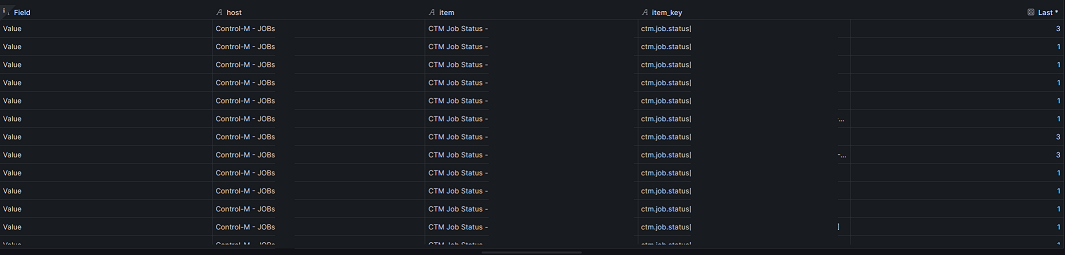
Switching to table view:
When I add the Group by transformation,
Panel with Group by:
Switching to table view:
I’ve managed to count the number of values using Reduce and Group by.
In the table view, I can see both statuses (Ended OK = 1, Executing = 3) that are currently active:
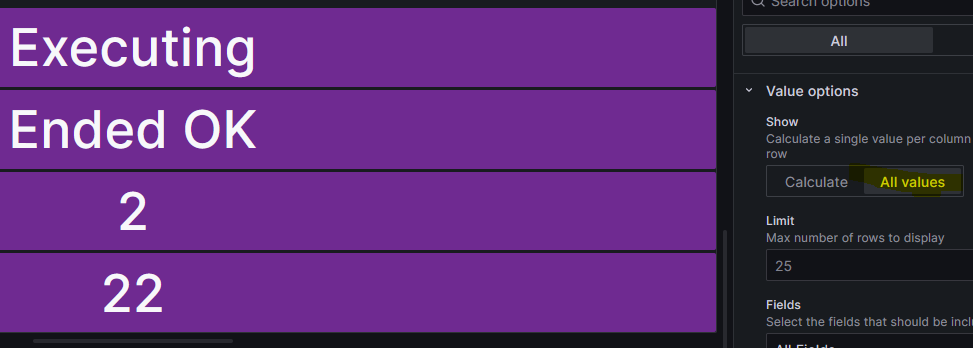
But, when I switch to the panel view, only Ended OK status is displayed.
If I change the Stat panel “Value options” to “Show All values”, both current states are displayed but not in the right order.
I can’t wrap my head around this.
Finally, I was able to count all values by each state.Reduce, Group by and Rows to fields transformations were necessary, followed by a Add field from calculation just to sum all values.
It is now what I had in mind.
Thank you all for your efforts to help me achieve this. All the feedback and suggestions have been invaluable.
4 Likes