Hello,
I wanted to understand the correct representation of counter metrics prometheus.
I have one counter metrics coming from prometheus data source and I need help in its correct representation on time-series graph.
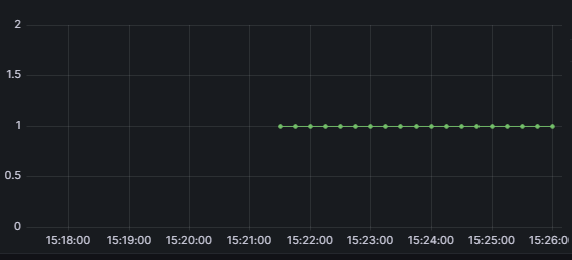
I am fetching some value and as per graph, there was a positive value “1” at 15:21 (only one occurrence). Even though than metrics has not generated any value, graph is continuing with value “1” instead it should drop to “0” when there is no increase in value.
I need help how to represent the said requirement.
“when metrics does not generate any value, graph is continuing with value “1” instead it should drop to “0” when there is no increase in value.”
Please advice.
Thanks.