Connecting Grafana to Prometheus

Hi All,

Sorry if this topic was already covered, if so please direct me… could not find any related info.
I have just installed Prometheus and Grafana (details below) on the same host.
I add the Prometheus data source and it hooked correctly but still I get no data point.
I get correctly data from other sources and it is presented correctly.
Is there any specific configuration that has to be done? Additional package that need to be installed?
I will appreciate any insight or direction to relevant document.

Thanks.
Zohar.

grafana-4.3.2
Prometheus Build Information
Version 1.7.1
Revision 3afb3fffa3a29c3de865e1172fb740442e9d0133
Branch master
BuildDate 20170612-11:45:58
GoVersion go1.8.3

Are you getting any errors in the Chrome Dev Tools console or in the Grafana server logs?

Can you check the raw query and raw data to see if anything is being returned. Here is a guide.

Thanks.
No, No errors all is well I have attached a screenshot and log sample with 200 success code.

path=/ status=200 remote_addr=84.108.25.162 time_ms=4 size=10892
t=2017-06-26T10:39:17+0000 lvl=info msg=“Request Completed” logger=context userId=1 orgId=1 uname=admin method=GET
path=/api/dashboards/home status=200 remote_addr=84.108.25.162 time_ms=2 size=1452
t=2017-06-26T10:39:17+0000 lvl=dbug msg=“Scheduling update” logger=alerting.scheduler ruleCount=0
t=2017-06-26T10:39:18+0000 lvl=info msg=“Request Completed” logger=context userId=1 orgId=1 uname=admin method=GET
path=/api/plugins status=200 remote_addr=84.108.25.162 time_ms=1 size=2
t=2017-06-26T10:39:18+0000 lvl=info msg=“Request Completed” logger=context userId=1 orgId=1 uname=admin method=GET
path=/api/search status=200 remote_addr=84.108.25.162 time_ms=3 size=131
t=2017-06-26T10:39:18+0000 lvl=info msg=“Request Completed” logger=context userId=1 orgId=1 uname=admin method=GET
path=/api/search status=200 remote_addr=84.108.25.162 time_ms=2 size=2
t=2017-06-26T10:39:18+0000 lvl=info msg=“Request Completed” logger=context userId=1 orgId=1 uname=admin method=GET
path=/api/search status=200 remote_addr=84.108.25.162 time_ms=2 size=603
t=2017-06-26T10:39:18+0000 lvl=info msg=“Request Completed” logger=context userId=1 orgId=1 uname=admin method=GET
path=/api/org/users status=200 remote_addr=84.108.25.162 time_ms=1 size=83
t=2017-06-26T10:39:27+0000 lvl=dbug msg=“Scheduling update” logger=alerting.scheduler ruleCount=0

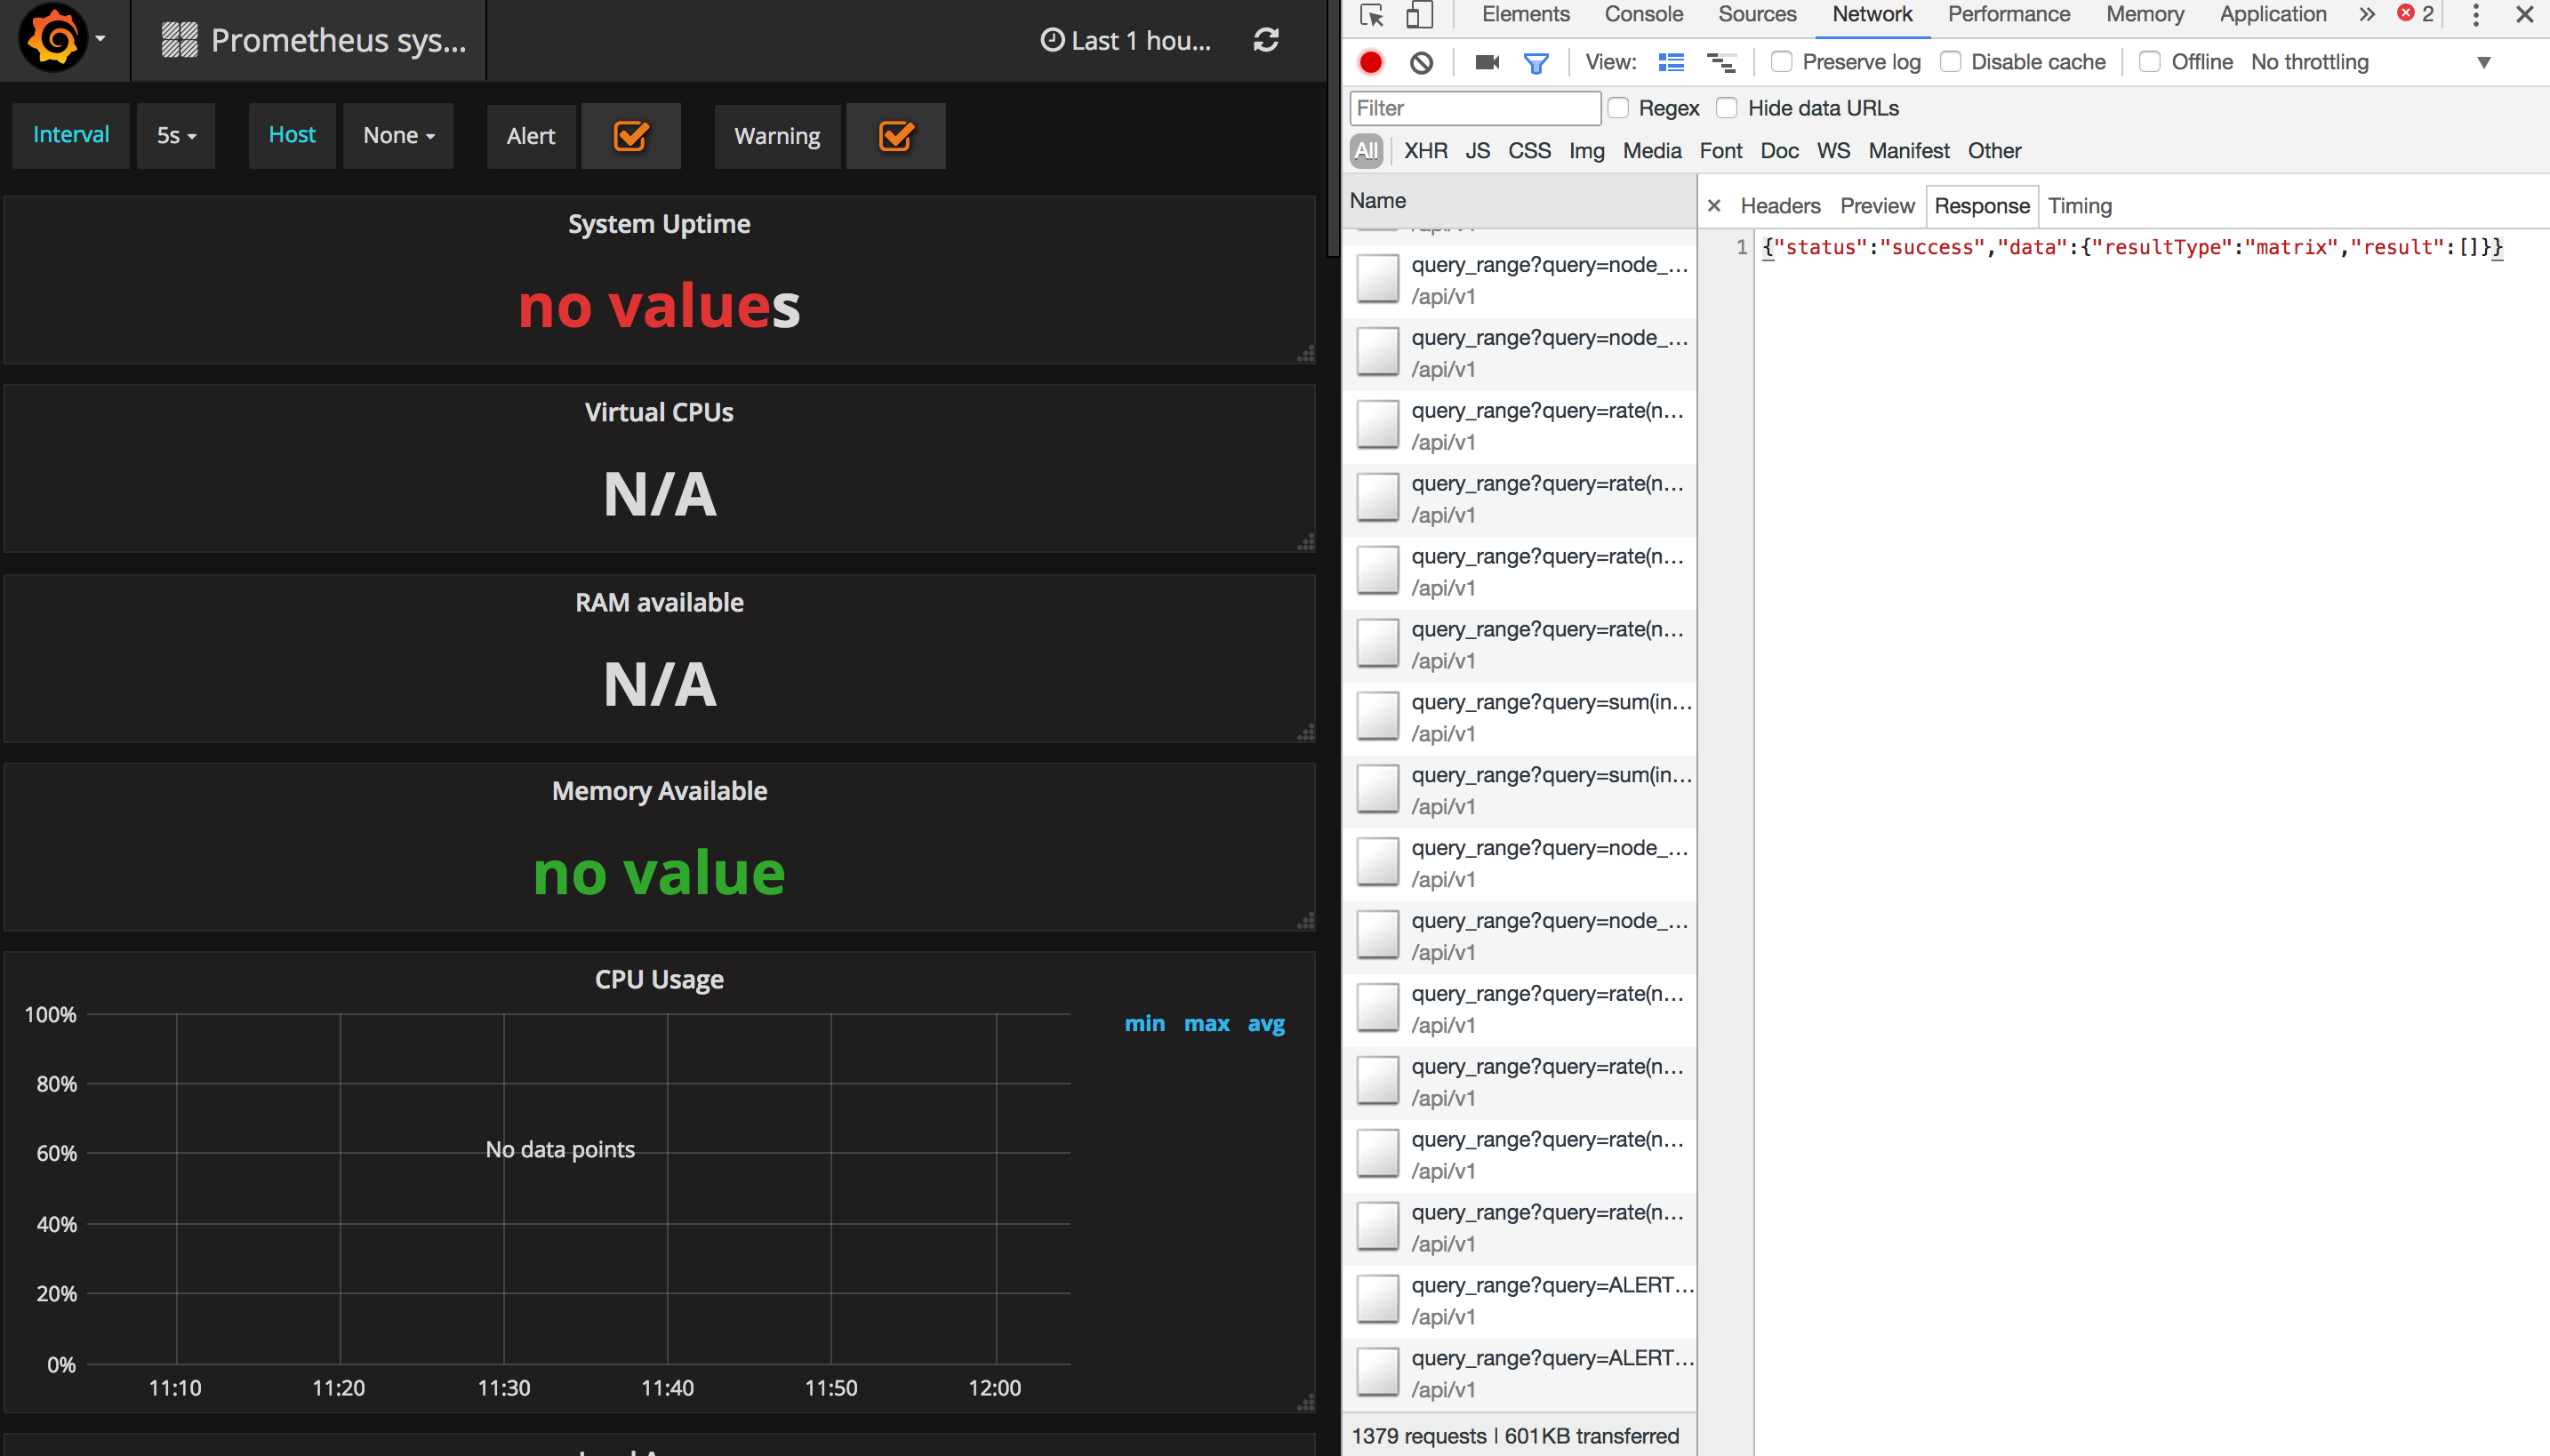
Can you show the response’s raw data for one of the queries as described in the how to guide. Click on one of the queries in the network tab and then click on the response tab tab and then paste the contents of the response here.

Sure I can. See below few examples:
Also attached the screenshot of the datasource test success.

Thanks a lot in advance for your time.
Zohar.

1.Request URL:http://54.255.225.168:9090/api/v1/query_range?query=node_memory_SwapFree{alias%3D""}&start=1498482867&end=1498486467&step=10
Request Method:GET
Status Code:200 OK
Remote Address:54.255.225.168:9090
Referrer Policy:no-referrer-when-downgrade
Response Headers
view source
Access-Control-Allow-Headers:Accept, Authorization, Content-Type, Origin
Access-Control-Allow-Methods:GET, OPTIONS
Access-Control-Allow-Origin:*
Access-Control-Expose-Headers:Date
Content-Encoding:gzip
Content-Length:87
Content-Type:application/json
Date:Mon, 26 Jun 2017 14:14:31 GMT
Request Headers
view source
Accept:application/json, text/plain, /
Accept-Encoding:gzip, deflate, sdch
Accept-Language:en-US,en;q=0.8,he;q=0.6
Connection:keep-alive
DNT:1
Host:54.255.225.168:9090
Origin:http://54.255.225.168:3000
Referer:http://54.255.225.168:3000/dashboard/db/prometheus-system?refresh=30s&orgId=1
User-Agent:Mozilla/5.0 (Macintosh; Intel Mac OS X 10_12_5) AppleWebKit/537.36 (KHTML, like Gecko) Chrome/58.0.3029.110 Safari/537.36
Query String Parameters
view source
view URL encoded
query:node_memory_SwapFree{alias=“”}
start:1498482867
end:1498486467
step:10

  1. Request URL:http://54.255.225.168:9090/api/v1/query_range?query=ALERTS{alias%3D"“%2C%20alertstate%3D"firing”}&start=1498483025&end=1498486625&step=60s
    Request Method:GET
    Status Code:200 OK
    Remote Address:54.255.225.168:9090
    Referrer Policy:no-referrer-when-downgrade
    Response Headers
    view source
    Access-Control-Allow-Headers:Accept, Authorization, Content-Type, Origin
    Access-Control-Allow-Methods:GET, OPTIONS
    Access-Control-Allow-Origin:*
    Access-Control-Expose-Headers:Date
    Content-Encoding:gzip
    Content-Length:87
    Content-Type:application/json
    Date:Mon, 26 Jun 2017 14:17:11 GMT
    Request Headers
    view source
    Accept:application/json, text/plain, /
    Accept-Encoding:gzip, deflate, sdch
    Accept-Language:en-US,en;q=0.8,he;q=0.6
    Connection:keep-alive
    DNT:1
    Host:54.255.225.168:9090
    Origin:http://54.255.225.168:3000
    Referer:http://54.255.225.168:3000/dashboard/db/prometheus-system?refresh=30s&orgId=1
    User-Agent:Mozilla/5.0 (Macintosh; Intel Mac OS X 10_12_5) AppleWebKit/537.36 (KHTML, like Gecko) Chrome/58.0.3029.110 Safari/537.36
    Query String Parameters
    view source
    view URL encoded
    query:ALERTS{alias=“”, alertstate=“firing”}
    start:1498483025
    end:1498486625
    step:60s

  2. Request URL:http://54.255.225.168:9090/api/v1/query_range?query=rate(node_network_receive_bytes{alias%3D"“%2C%20device!%3D"lo”}[5s])%20or%20irate(node_network_receive_bytes{alias%3D"“%2C%20device!%3D"lo”}[5m])&start=1498483142&end=1498486742&step=10
    Request Method:GET
    Status Code:200 OK
    Remote Address:54.255.225.168:9090
    Referrer Policy:no-referrer-when-downgrade
    Response Headers
    view source
    Access-Control-Allow-Headers:Accept, Authorization, Content-Type, Origin
    Access-Control-Allow-Methods:GET, OPTIONS
    Access-Control-Allow-Origin:*
    Access-Control-Expose-Headers:Date
    Content-Encoding:gzip
    Content-Length:87
    Content-Type:application/json
    Date:Mon, 26 Jun 2017 14:19:05 GMT
    Request Headers
    view source
    Accept:application/json, text/plain, /
    Accept-Encoding:gzip, deflate, sdch
    Accept-Language:en-US,en;q=0.8,he;q=0.6
    Connection:keep-alive
    DNT:1
    Host:54.255.225.168:9090
    Origin:http://54.255.225.168:3000
    Referer:http://54.255.225.168:3000/dashboard/db/prometheus-system?refresh=30s&orgId=1
    User-Agent:Mozilla/5.0 (Macintosh; Intel Mac OS X 10_12_5) AppleWebKit/537.36 (KHTML, like Gecko) Chrome/58.0.3029.110 Safari/537.36
    Query String Parameters
    view source
    view URL encoded
    query:rate(node_network_receive_bytes{alias=“”, device!=“lo”}[5s]) or irate(node_network_receive_bytes{alias=“”, device!=“lo”}[5m])
    start:1498483142
    end:1498486742
    step:10

And another example of a working dashboard (AWS Datasource).
Just an FYI
Request URL:http://54.255.225.168:3000/api/datasources/proxy/2
Request Method:POST
Status Code:200 OK
Remote Address:54.255.225.168:3000
Referrer Policy:no-referrer-when-downgrade
Response Headers
view parsed
HTTP/1.1 200 OK
Content-Type: application/json; charset=UTF-8
Date: Mon, 26 Jun 2017 14:30:17 GMT
Content-Length: 44
Request Headers
view parsed
POST /api/datasources/proxy/2 HTTP/1.1
Host: 54.255.225.168:3000
Connection: keep-alive
Content-Length: 291
Origin: http://54.255.225.168:3000
X-Grafana-Org-Id: 1
User-Agent: Mozilla/5.0 (Macintosh; Intel Mac OS X 10_12_5) AppleWebKit/537.36 (KHTML, like Gecko) Chrome/58.0.3029.110 Safari/537.36
Content-Type: application/json;charset=UTF-8
Accept: application/json, text/plain, /
DNT: 1
Referer: http://54.255.225.168:3000/dashboard/db/aws-elb-classic-load-balancer?orgId=1
Accept-Encoding: gzip, deflate
Accept-Language: en-US,en;q=0.8,he;q=0.6
Cookie: grafana_sess=8d2f3dc62ba48a26; grafana_user=admin; grafana_remember=0321ab2ca6f6c83ff0c7de79761487f568f3690624bd8f97d70deaf3c8574f2b6f; toggles=%7B%22ui-wp-upgrade%22%3Atrue%7D
Request Payload
view source
{region: “ap-xxxx”, action: “GetMetricStatistics”,…}
action
:
"GetMetricStatistics"
parameters
:
{namespace: “AWS/ELB”, metricName: “SpilloverCount”,…}
region
:
“ap-xxxx1”

Any idea anyone? Should there be any specific line in the prometheus.yml?
Is there additional code needed to be installed other than prometheus-1.7.1.linux-386?

Thanks,
Zohar.

Those are the requests that you posted. Could you post the responses as well, please? While it is useful to be able to see the queries that were sent to Prometheus, it would be more useful to see the response data.

trying to find how I can present that … any idea?

Might be that Grafana does not actually send the request to Prometheus? I dont see anything coming to Prometheus on the logs.

It’s in the guide. But here is a screenshot showing how. There are four tabs, you pasted in the data from the Headers tab but the json response under the Response tab is what I’m looking for.

Please see attached the screenshot of the

nd response

So the query is not returning any results. If this query above, is one of the queries not returning data, are you sure that the query is correct and that this data is stored in Prometheus?

What I have done till now is implementing the Prometheus out of the box w/out any configuration. and added 2 host the Prometheus server itself anf a docker host exposing via Cadvisor all the default metrics.
Than added to Grafana some dashboards that as far as I know presenting the trivial counters.

Yes, I can see that the related query is returning empty from the Prometheus console itself.
This is the config file - any idea what should be changed?
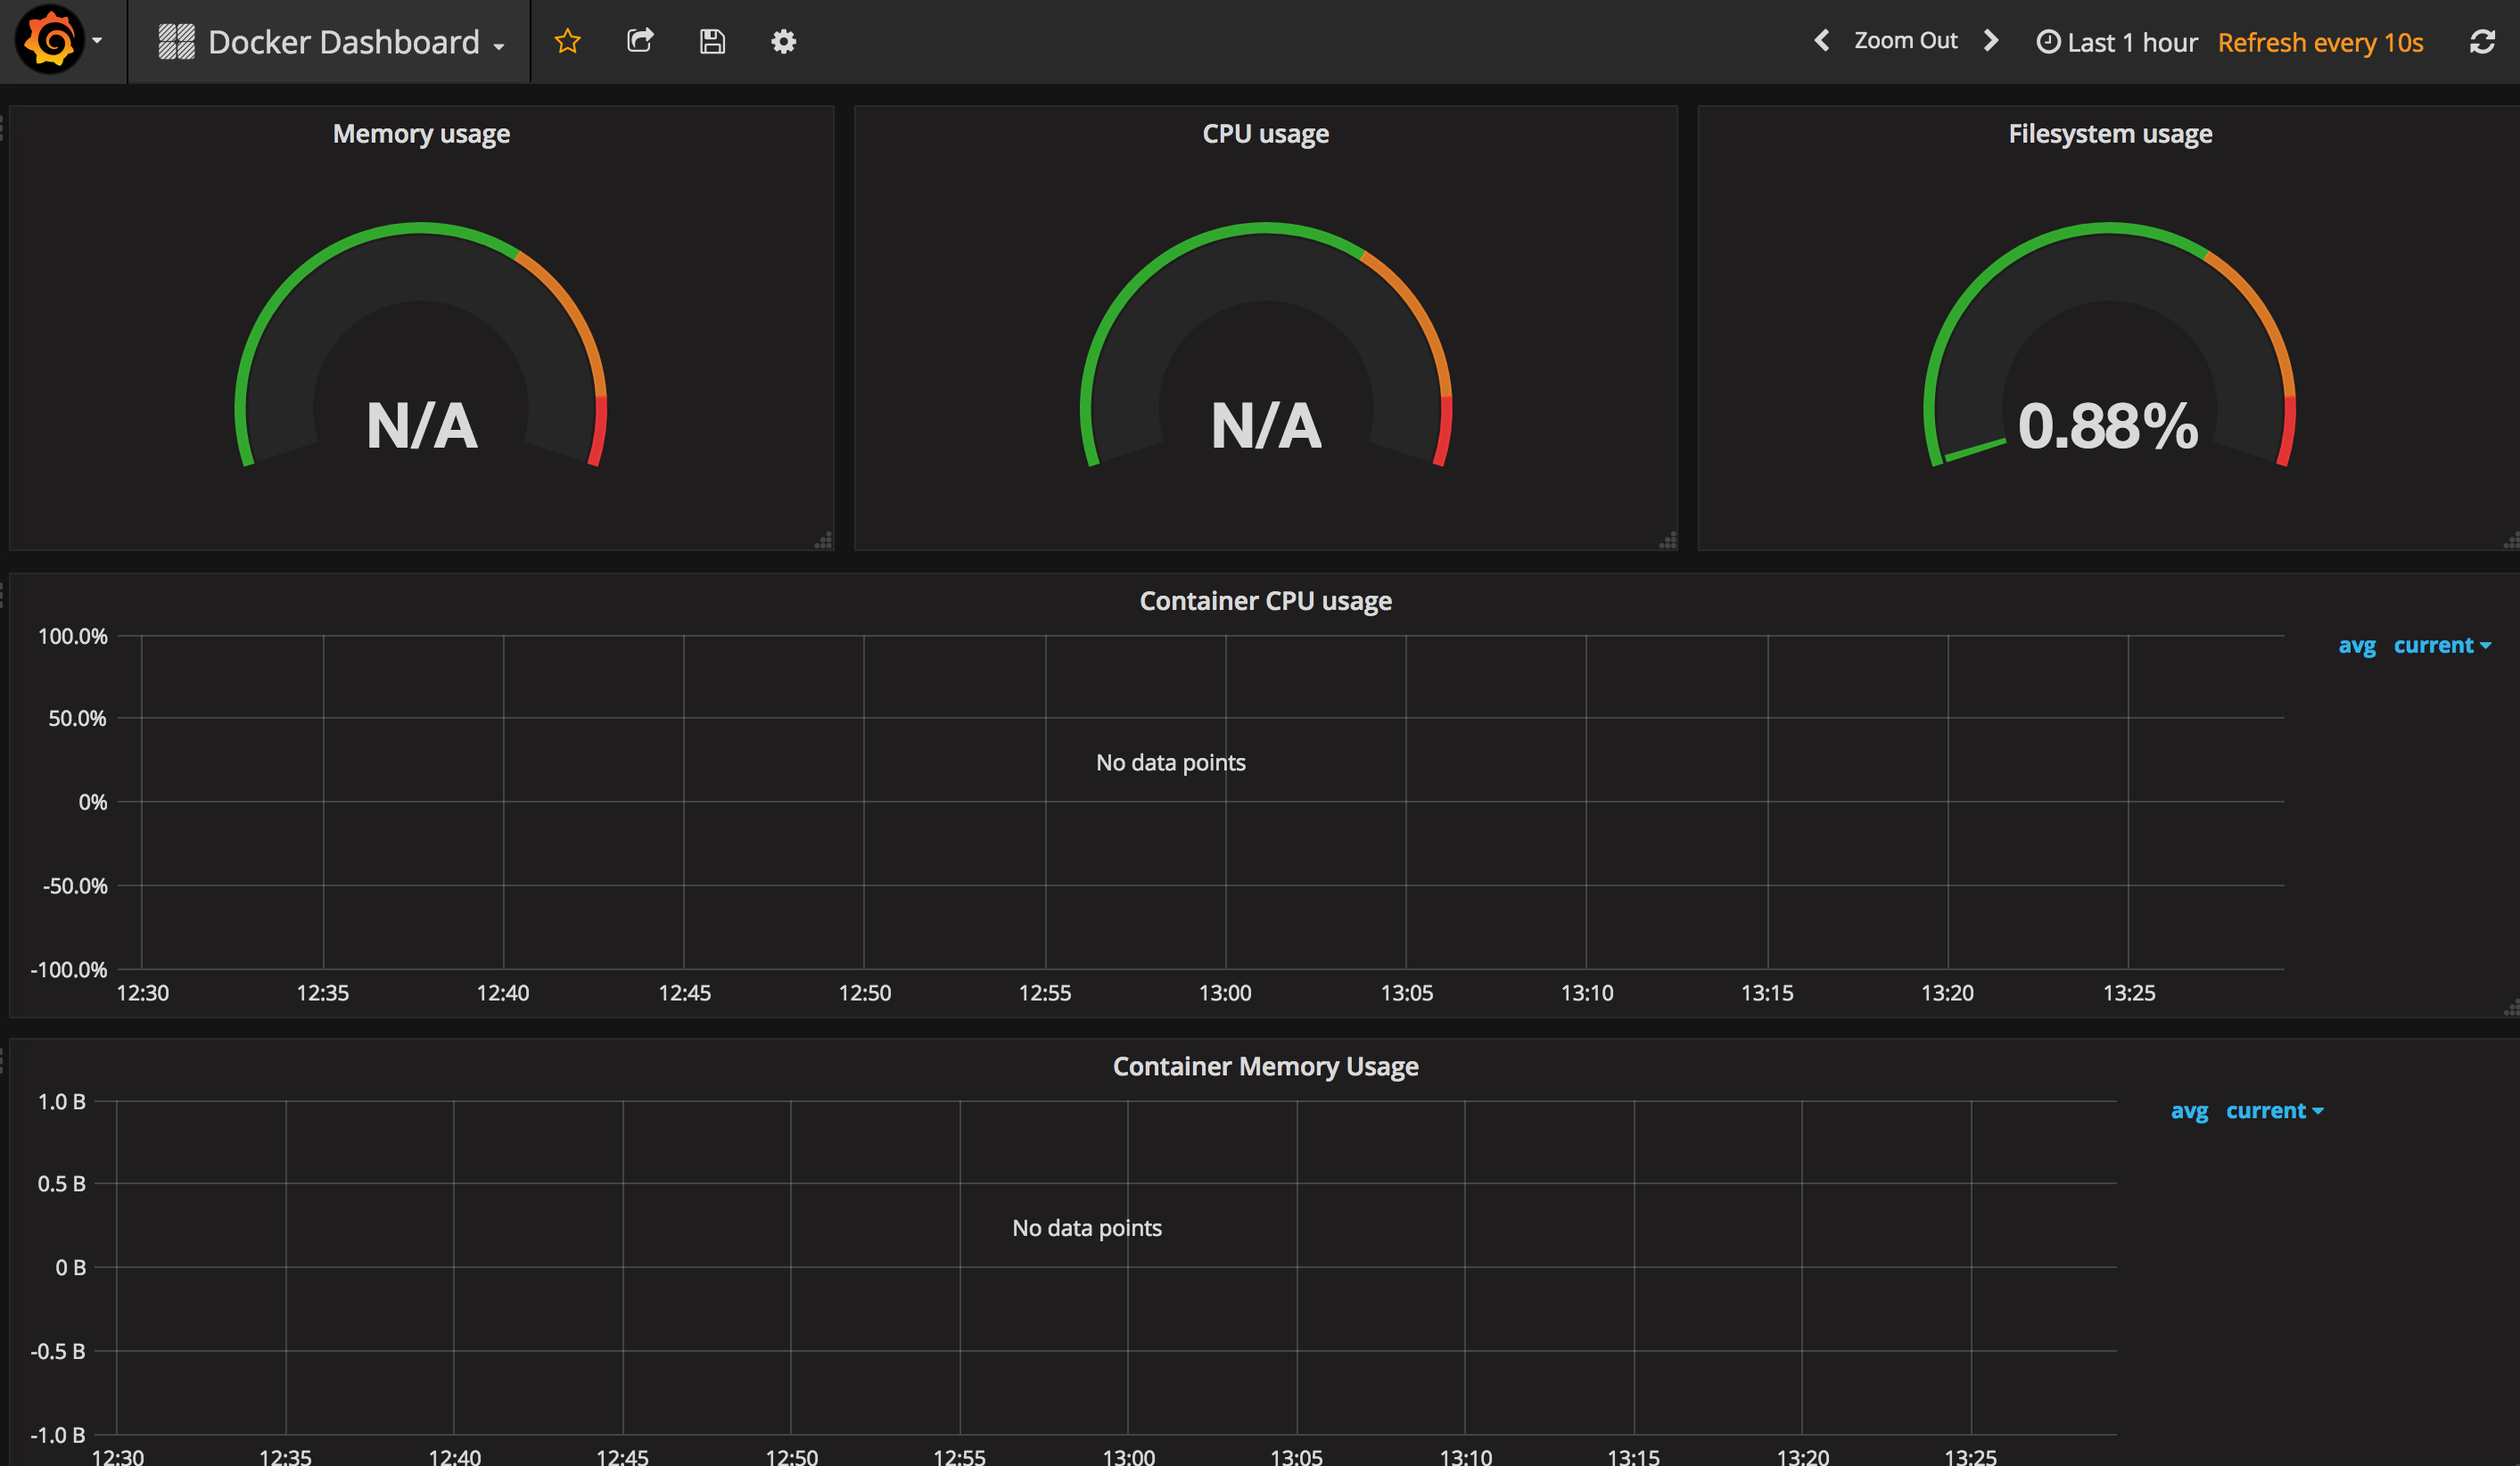
The Docker dashboard also returns empty…

my global config

global:
scrape_interval: 15s # Set the scrape interval to every 15 seconds. Default is every 1 minute.
evaluation_interval: 15s # Evaluate rules every 15 seconds. The default is every 1 minute.

scrape_timeout is set to the global default (10s).

Attach these labels to any time series or alerts when communicating with

external systems (federation, remote storage, Alertmanager).

external_labels:
monitor: ‘prod-monitor’

scrape_configs:

  • job_name: ‘node’
    ec2_sd_configs:
    • region: ‘-SSS-1b’
      access_key: XXXXXXX
      secret_key: XXXXXXX
      port: 9100
  • job_name: ‘cAdvisor’
    static_configs:
    • targets: [‘10.0.4.70:8080’]

Load rules once and periodically evaluate them according to the global ‘evaluation_interval’.

rule_files:

- “first.rules”

- “second.rules”

A scrape configuration containing exactly one endpoint to scrape:

Here it’s Prometheus itself.

scrape_configs:

  • job_name: ‘prometheus’
    static_configs:
    • targets: [‘localhost:9090’]
  • job_name: ‘node-exporter’
    static_configs:
    • targets: [‘10.0.4.70:8080’]

Some more information - I hope it will help.
Diving into the Docker dashboard see attached screenshot I found that the Metric lookup in this case “container_cpu_user_seconds_total” is available on the Prometheus console but the query sort_desc(sum(rate(container_cpu_user_seconds_total{image!=“”}[1m])) by (name)) returns w/out data.
Any idea?

The open question remain why “container_cpu_user_seconds_total” is available on the Prometheus console but the query sort_desc(sum(rate(container_cpu_user_seconds_total{image!=""}[1m])) by (name)) returns w/out data.
Any idea?

Thanks a lot!
The first query rate(node_network_receive_bytes{alias="", device!=“lo”}[5s]) return no data.
The second one: rate(node_network_receive_bytes{alias="", device!=“lo”}[5m]) returns data.
What should I do in order to store relevant data?
All the queries I am using are from dashboard I have download. For now w/out any customization.
Another example is:
“container_cpu_user_seconds_total” is stored and I can see data.
but the query on top of it sort_desc(sum(rate(container_cpu_user_seconds_total{image!=""}[1m])) returns no data???
What am I missing in the configuration?

Thanks,
Zohar.

Sorry, not an expert when it comes to Prometheus queries. Have you tried asking at the Prometheus google group: https://groups.google.com/forum/#!forum/prometheus-users

Yes, Thanks a lot.
https://groups.google.com/forum/#!topic/prometheus-users/n-qUv7RM2ok

I don’t see anything wrong with your query. If I was to guess it would be that container_cpu_user_seconds_total does not have a tag called image.

Try breaking it down in steps and see which step does not work:

  1. container_cpu_user_seconds_total
  2. rate(container_cpu_user_seconds_total[1m])
  3. rate(container_cpu_user_seconds_total{image!=""}[1m])
  4. sum(rate(container_cpu_user_seconds_total{image!=""}[1m])
  5. sort_desc(sum(rate(container_cpu_user_seconds_total{image!=""}[1m]))

Go to the Prometheus GUI: http://localhost:9090/graph and select container_cpu_user_seconds_total to see what tags it has:

1 Like