Hello,
I have a app plugin with the following actions and scopes in IAM section of the plugin:
"iam": {
    "permissions": [
      { "action": "dashboards:read", "scope": "folders:uid:*" },
      { "action": "annotations:read", "scope": "annotations:type:*" },
      { "action": "datasources:query", "scope": "datasources:*" },
      { "action": "users.permissions:read", "scope": "users:*" }
    ]
  }
Until Grafana 11.x, the service account token created during plugin startup can be used to access Grafana API, specifically, dashboards in my case. Starting with Grafana 12.x (I tested on Grafana 12.0.2), the API returns 404. I noticed that dashboards API has evolved in 12.x but seems like legacy API is still supported. To ensure that there is nothing wrong with plugin, I have logged the service account token and made a request to API using curl and I get same result:
With Grafana 11.6.0:
curl -I -H "Authorization: Bearer <token>" localhost:3000/api/dashboards/uid/e472bbf0-140c-4852-a74b-1a4c32202659
HTTP/1.1 200 OK
Cache-Control: no-store
Content-Type: application/json
X-Content-Type-Options: nosniff
X-Frame-Options: deny
X-Xss-Protection: 1; mode=block
Date: Wed, 23 Jul 2025 13:27:24 GMT
With Grafana 12.0.2:
curl -I -H "Authorization: Bearer <token>" localhost:3000/api/dashboards/uid/e472bbf0-140c-4852-a74b-1a4c32202659
HTTP/1.1 404 Not Found
Cache-Control: no-store
Content-Type: application/json
X-Content-Type-Options: nosniff
X-Frame-Options: deny
X-Xss-Protection: 1; mode=block
Date: Wed, 23 Jul 2025 13:29:01 GMT
Is it a bug or is something has changed? I have looked into changelog and I could not find anything. Any help will be greatly appreciated.
Cheers!!
It is likely the API endpoint changed in v12.
Hello @academo
Thanks for the reply and sorry for late response. I was in vacations.
Well, the API endpoint works. If I create a service account token using Admin role and make an API request with that token, it works. The API endpoint works as well when I do the request from the browser (using cookie).
So, that brings the question of something missing in iam.permissions in the plugin.json. But I dont see what action and scope I need to add apart from existing to read dashboards. Do you think it is worth creating an issue in Grafana repo?
Cheers!!
Hey  ,
,
Thanks for posting.I tried to reproduce (with v12.0.3) but “bad luck”, it works on my side  .
.
Nothing in the logs to guide us as to what could be missing when you query the dashboard?
Are the permissions correctly granted to your service account? You could check that with:
curl -H “Authorization: Bearer $saToken” --insecure -X GET https://YOUR_URL/api/access-control/user/permissions | jq -r
{
  "annotations:read": [
    "annotations:type:*"
  ],
  "dashboards:read": [
    "folders:uid:*"
  ],
  "datasources:query": [
    "datasources:*"
  ],
  "folders:read": [
    "folders:uid:sharedwithme"
  ],
  "users.permissions:read": [
    "users:*"
  ]
}
Hope this helps!
Hello @gabrielmabille
Really appreciate your effort in testing it. It is really strange that it works for you!! Did you test it using a plugin?
I made a reproducer for quick demo. This demo is based off one of the old plugin examples. Here are the instructions to reproduce the bug.
git clone https://github.com/mahendrapaipuri/grafana-plugin-with-service-repro-app
git checkout bug/plugin_svc_token_not_working
yarn build:prod
docker compose up --build
Once the Grafana server is up and running, navigate to http://localhost:3000/a/grafana-appwithserviceaccount-app/one and make a request to fetch the dashboard and I get the following response:
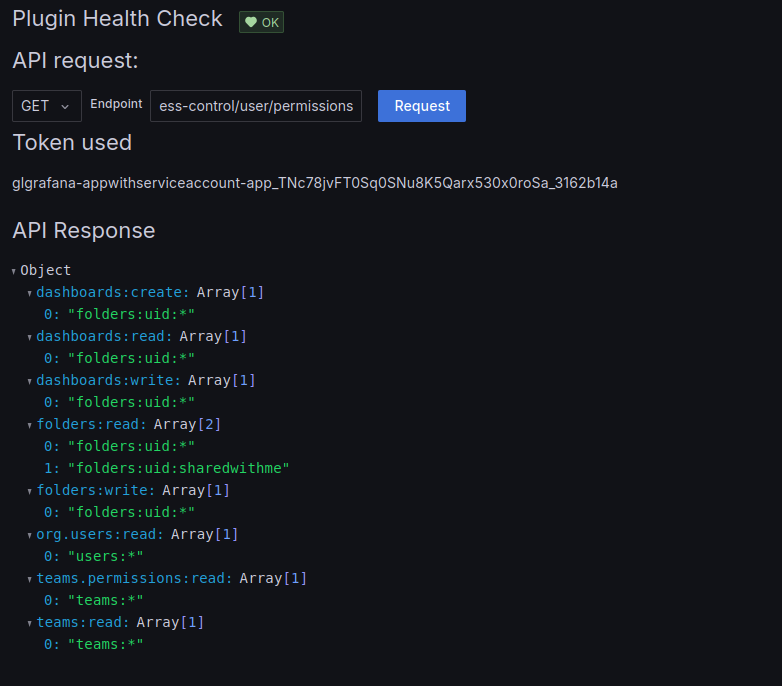
And seems like service account provisioned token has correct permissions:
In the reproducer I am using the same version as your’s 12.0.3.
And here are the relevant logs in DEBUG mode:
[grafana] | logger=plugin.grafana-appwithserviceaccount-app t=2025-09-20T17:06:08.441314471Z level=info msg=request endpoint=callResource pluginId=grafana-appwithserviceaccount-app pluginVersion=1.0.0 url=http://localhost:3000/api/dashboards/uid/new-dashboard
[grafana] | logger=id-service t=2025-09-20T17:06:08.465683273Z level=debug msg="Sign new id token" id=service-account:2
[grafana] | logger=accesscontrol t=2025-09-20T17:06:08.476590645Z level=debug msg="Evaluating permissions" id=service-account:2 orgID=1 permissions="action:dashboards:read scopes:dashboards:uid:new-dashboard"
[grafana] | logger=grafana-apiserver t=2025-09-20T17:06:08.476827622Z level=info msg="GET https://127.0.0.1:3000/apis/dashboard.grafana.app/v0alpha1/namespaces/default/dashboards/new-dashboard"
[grafana] | logger=grafana-apiserver t=2025-09-20T17:06:08.476858918Z level=info msg="Request Headers:"
[grafana] | logger=grafana-apiserver t=2025-09-20T17:06:08.476892082Z level=info msg="    User-Agent: grafana/v0.0.0 (linux/amd64) kubernetes/$Format"
[grafana] | logger=grafana-apiserver t=2025-09-20T17:06:08.476917139Z level=info msg="    Authorization: Bearer <masked>"
[grafana] | logger=grafana-apiserver t=2025-09-20T17:06:08.476936926Z level=info msg="    Accept: application/json"
[grafana] | logger=grafana-apiserver t=2025-09-20T17:06:08.477362045Z level=debug msg="grafana-apiserver: GET \"/apis/dashboard.grafana.app/v0alpha1/namespaces/default/dashboards/new-dashboard\" satisfied by gorestful with webservice /apis/dashboard.grafana.app/v0alpha1"
[grafana] | logger=grafana-apiserver t=2025-09-20T17:06:08.499306279Z level=info msg="Response Status: 200 OK in 22 milliseconds"
[grafana] | logger=grafana-apiserver t=2025-09-20T17:06:08.499266719Z level=debug msg=HTTP verb=GET URI= latency=22.124692ms userAgent="grafana/v0.0.0 (linux/amd64) kubernetes/$Format" audit-ID=7c4a7a17-f929-4277-b00e-715776fcaa27 srcIP= resp=200
[grafana] | logger=accesscontrol t=2025-09-20T17:06:08.500755683Z level=debug msg="Resolved scope" scope=dashboards:uid:new-dashboard resolved_scopes="[dashboards:uid:new-dashboard folders:uid:general]"
[grafana] | logger=accesscontrol t=2025-09-20T17:06:08.500828772Z level=debug msg="Evaluating resolved permissions" id=service-account:2 orgID=1 permissions="action:dashboards:read scopes:dashboards:uid:new-dashboard, folders:uid:general"
[grafana] | logger=accesscontrol.evaluator t=2025-09-20T17:06:08.500853209Z level=debug msg="Matched scope" userscope=folders:uid:* targetscope=folders:uid:general
[grafana] | logger=grafana-apiserver t=2025-09-20T17:06:08.501118294Z level=info msg="GET https://127.0.0.1:3000/apis/dashboard.grafana.app/v0alpha1/namespaces/default/dashboards/new-dashboard"
[grafana] | logger=grafana-apiserver t=2025-09-20T17:06:08.501159226Z level=info msg="Request Headers:"
[grafana] | logger=grafana-apiserver t=2025-09-20T17:06:08.501194118Z level=info msg="    Accept: application/json"
[grafana] | logger=grafana-apiserver t=2025-09-20T17:06:08.501220693Z level=info msg="    User-Agent: grafana/v0.0.0 (linux/amd64) kubernetes/$Format"
[grafana] | logger=grafana-apiserver t=2025-09-20T17:06:08.501246596Z level=info msg="    Authorization: Bearer <masked>"
[grafana] | logger=grafana-apiserver t=2025-09-20T17:06:08.501728802Z level=debug msg="grafana-apiserver: GET \"/apis/dashboard.grafana.app/v0alpha1/namespaces/default/dashboards/new-dashboard\" satisfied by gorestful with webservice /apis/dashboard.grafana.app/v0alpha1"
[grafana] | logger=grafana-apiserver t=2025-09-20T17:06:08.515431131Z level=info msg="Response Status: 403 Forbidden in 14 milliseconds"
[grafana] | logger=grafana-apiserver t=2025-09-20T17:06:08.515425525Z level=debug msg=HTTP verb=GET URI= latency=13.960416ms userAgent="grafana/v0.0.0 (linux/amd64) kubernetes/$Format" audit-ID=c24547d5-420e-4156-93e4-d38ffe1cc9dd srcIP= resp=403
[grafana] | logger=context userId=2 orgId=1 uname=sa-1-extsvc-grafana-appwithserviceaccount-app t=2025-09-20T17:06:08.515847848Z level=info msg="Request Completed" method=GET path=/api/dashboards/uid/new-dashboard status=404 remote_addr=127.0.0.1 time_ms=73 duration=73.158939ms size=33 referer= handler=/api/dashboards/uid/:uid status_source=server error=
[grafana] | logger=plugin.grafana-appwithserviceaccount-app t=2025-09-20T17:06:08.517032237Z level=info msg="Plugin Request Completed" duration=75.582638ms pluginId=grafana-appwithserviceaccount-app pluginVersion=1.0.0 status=ok endpoint=callResource statusSource=plugin
[grafana] | logger=context userId=1 orgId=1 uname=admin t=2025-09-20T17:06:08.517522556Z level=info msg="Request Completed" method=GET path=/api/plugins/grafana-appwithserviceaccount-app/resources/api/dashboards/uid/new-dashboard status=400 remote_addr=10.89.9.11 time_ms=86 duration=86.721053ms size=34 referer=http://localhost:3000/a/grafana-appwithserviceaccount-app/one handler=/api/plugins/:pluginId/resources/* status_source=server
Cheers!!